Many buyers who closed on a home before September 2025 locked in around 7% with the motto, “date the rate, marry the house,” intending to refinance once rates dropped. However, a study conducted by Neighbors Bank found that most 2025 buyers need a -0.75 rate decrease before they would see substantial savings from a refinance and break-even under three years.
Recently, rates have slipped closer to 6.1%, a meaningful drop from the 6.8% buyers were seeing in January of this year. You can see here how buyers who closed on a home in November 2024 onwards would fare in the new rate environment.
Overall, our study examines how refinance opportunities vary specifically for 2025 buyers across loan types, terms, and locations. Here are some of our data highlights:
Government-backed loans take nearly twice as long to break even as conventional loans.
15-year buyers recoup costs much faster than 30-year buyers. With a 0.5-point rate drop, 15-year buyers could save more than $1,500 within three years. In contrast, 30-year buyers remain slightly underwater during the same period.
State-level factors, including loan sizes, property taxes, homeowners insurance, and title fees, play a major role in refinance savings.
With a 0.5-point reduction, only 10 states see buyers break even within three years.
Note: These scenarios are for example purposes, to showcase possible costs and savings for a consumer who refinances their mortgage. Please see our methodology for more information.
When Does a Refinance Make Sense?
Even without a dramatic rate drop, refinancing can still pay off under the right conditions. The break-even point is when the total savings from a lower rate are greater than the upfront closing costs of the refinance. As a rule of thumb, borrowers typically look for a break-even point within about 3 years to make refinancing worthwhile.
Beyond rate savings, refinancing may also make sense if you need to:
Access built-in equity through a cash-out refinance
Lower your monthly payment by extending the loan term
Switch from an adjustable-rate mortgage to a fixed-rate product for stability
While equity access and rate structure switches are important tools, our analysis focuses solely on potential savings borrowers can gain through rate and term refinancing.
So how long would it take for a 2025 buyer to recoup refinancing costs? To help answer these questions, we analyzed average 2025 mortgage rates and modeled savings and break-even timelines for rate drops of 0.25 to 1 percentage point across common borrowing scenarios. Let’s take a look:
Most Buyers Will Need More Than a 0.5-Point Drop to Profit
In 2025, repeat buyers still account for the majority of home purchases*. We found that the average 2025 buyer had a 25% down payment, a 30-year term at 6.798%, a $386,339 loan amount, and $5,458 in closing costs for a refinance.
Using these benchmarks, here’s how the typical 2025 homeowner would fare with modest rate drops of 0.25, 0.5, 0.75, and 1.0 percentage points.
Note: This scenario assumes the home purchase occurred in January 2025 and the homeowner made seven months of mortgage payments before refinancing. For a full list of assumptions, refer to our methodology.
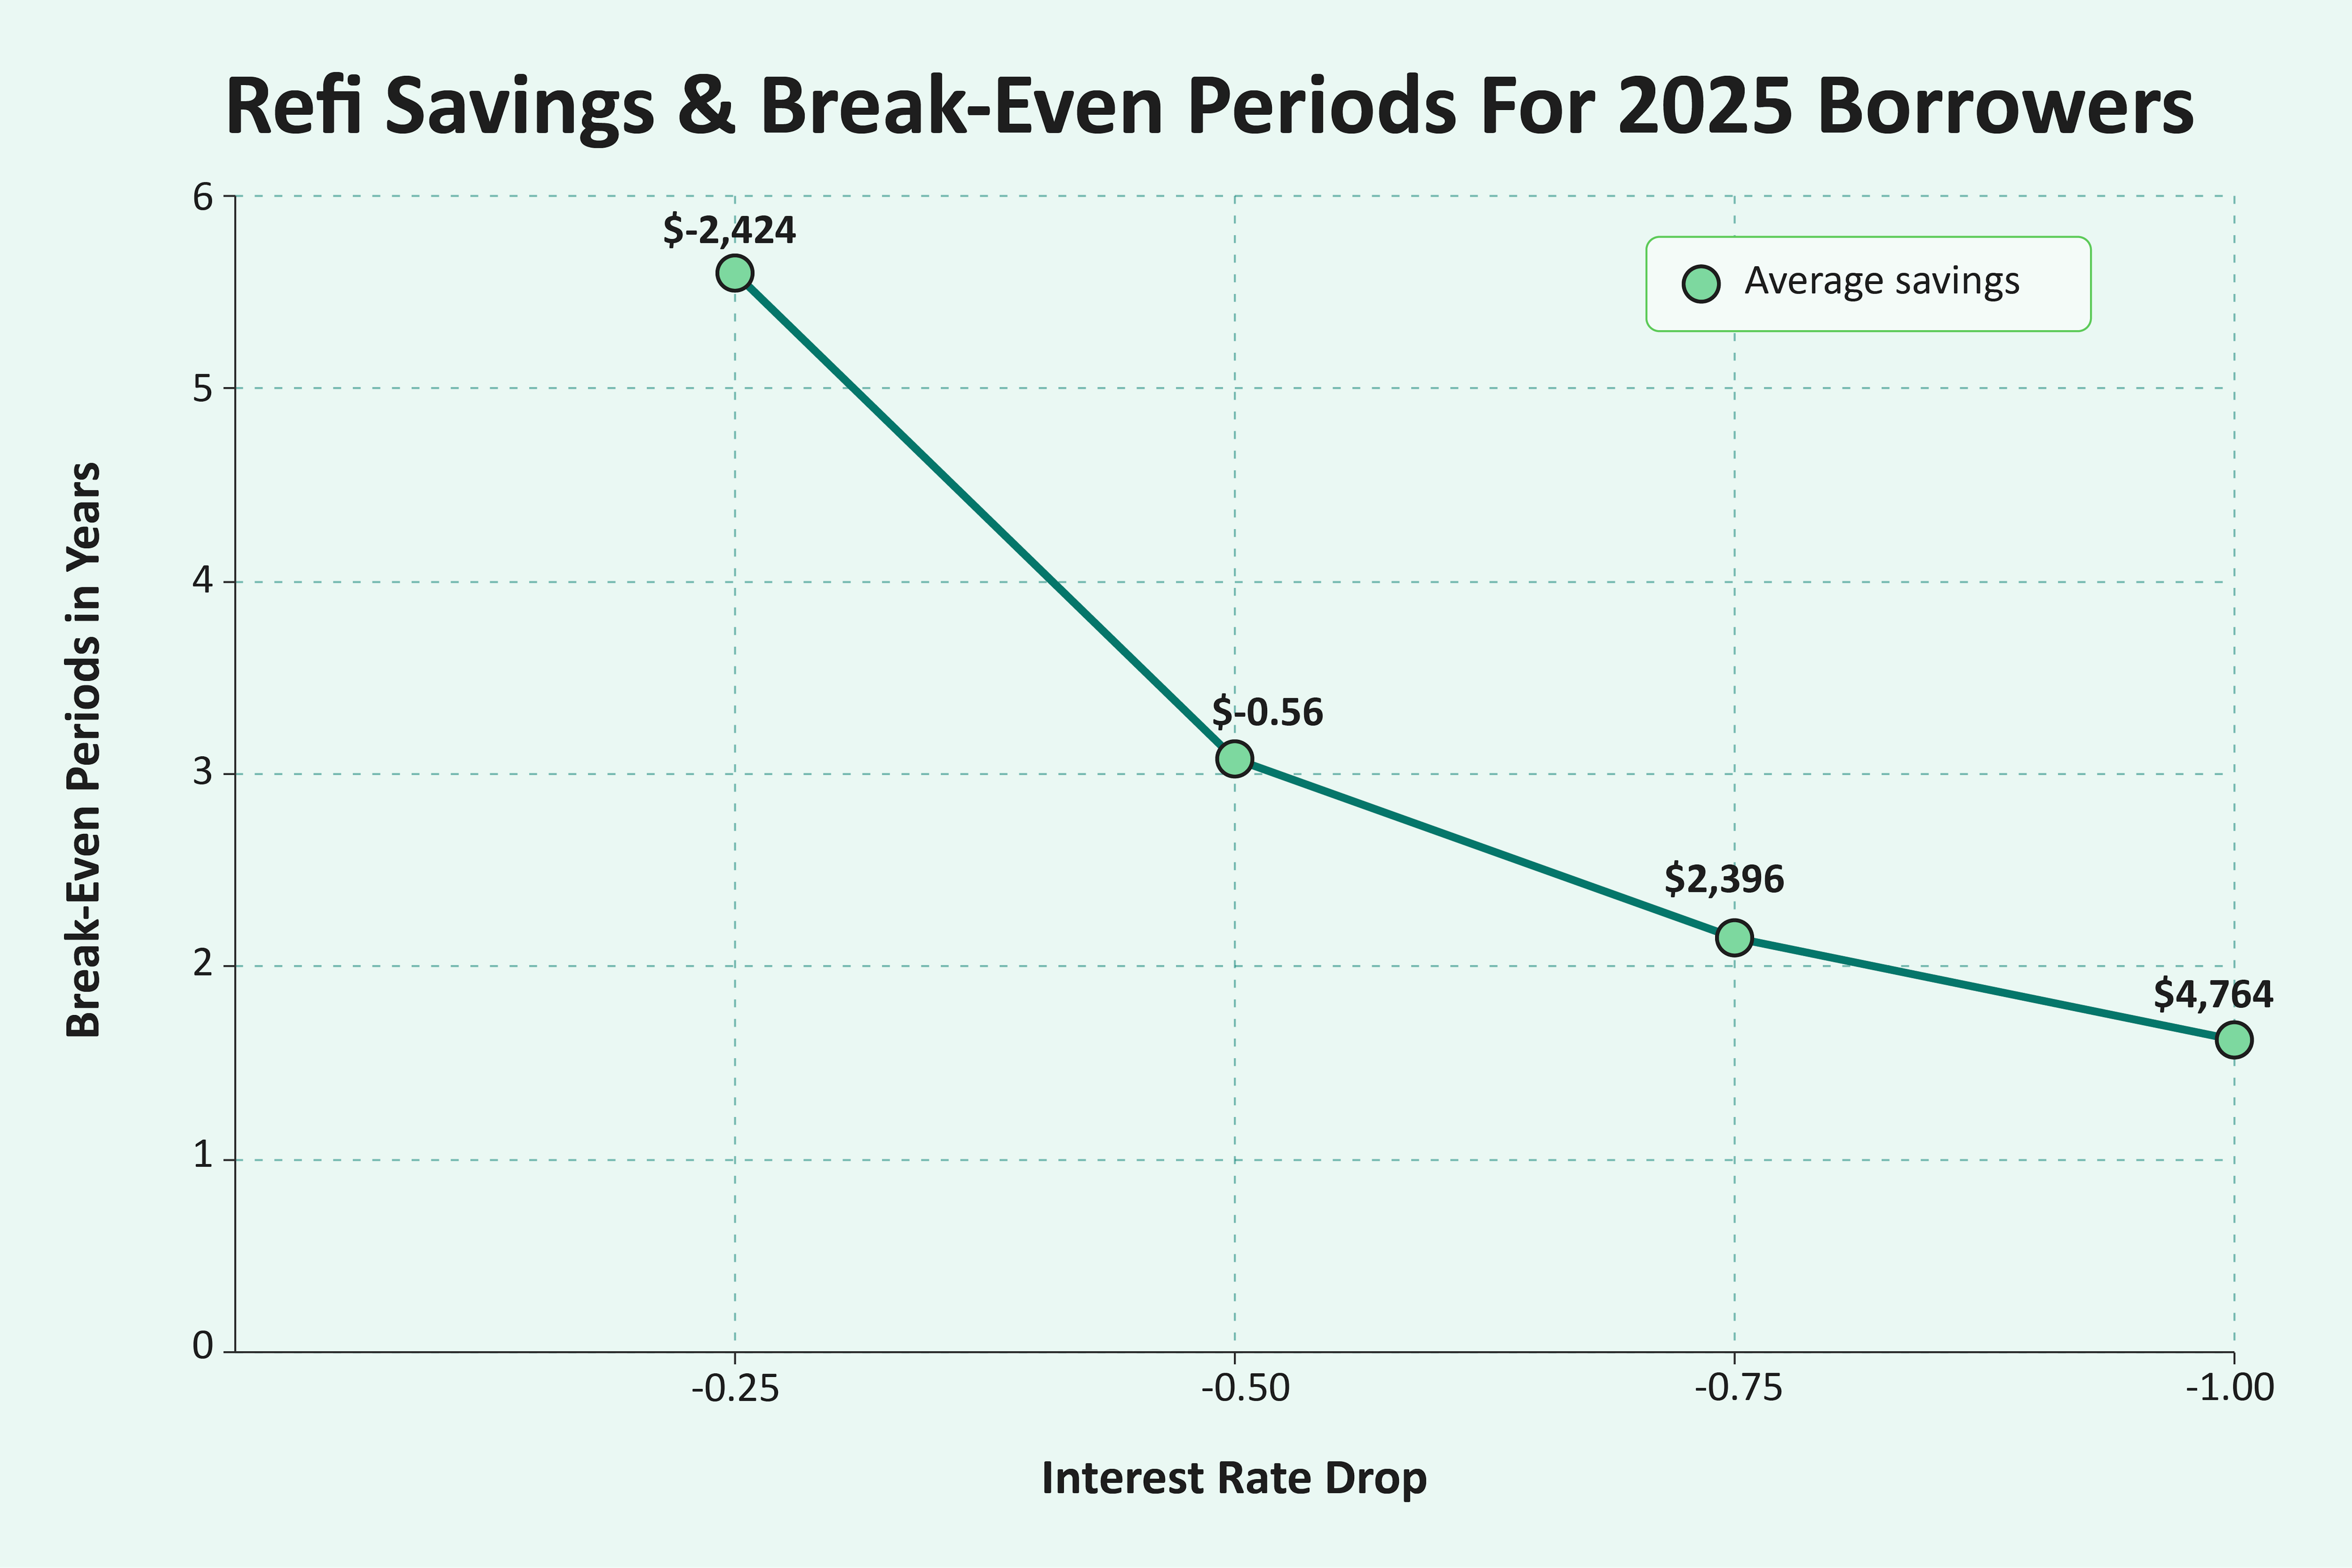
Based on our modeling, it’d take a drop of at least 0.6 points before a rate cut would deliver clear gains within a reasonable timeframe.
At a quarter-point drop, borrowers would still be $2,424 underwater after three years and need more than five years to break even. A half-point reduction shortens the break-even timeline to 3.08 years, but borrowers still don’t see any payoff at that point.
A 0.75-point cut brings the break-even point to just under three years, after which homeowners begin to see positive savings. Finally, a full percentage-point drop slashes the payoff window to 20 months and produces $4,764 in net savings in under 2 years.
Who Benefits Most After September 2025 Rate Drops?
Given that the mortgage interest rate dropped in September 2025, we examined how buyers who recently closed on a loan would stand to benefit. We examined the average interest rates of borrowers who closed on a home from November 2024 onwards, looking at their average break-even period and average refinance savings with a new rate of 6.13%.
Average Refinance Savings By Month Closed (With 6.13% Rate)
| Month Closed | Average Interest Rate | Average Years To Break-Even | Average Refi Savings After 3 Years | Average Refi Savings Over Life of Loan |
|---|---|---|---|---|
| November 2024 | 6.805% | 2.3 | $1,461.75 | $63,518.37 |
| December 2024 | 6.715% | 2.8 | $564.68 | $54,566.97 |
| January 2025 | 6.958% | 2.0 | $2,713.46 | $76,086.39 |
| February 2025 | 6.8425% | 2.3 | $1,576.67 | $64,737.05 |
| March 2025 | 6.65% | 3.2 | -$260.85 | $46,379.16 |
| April 2025 | 6.72% | 2.8 | $347.05 | $52,483.08 |
| May 2025 | 6.816% | 2.5 | $1,107.20 | $60,109.05 |
| June 2025 | 6.8175% | 2.5 | $1,045.87 | $59,518.18 |
| July 2025 | 6.72% | 3.0 | $71.91 | $49,800.00 |
| August 2025 | 6.614% | 3.7 | -$979.21 | $39,310.99 |
Refi Comparisons For 15- vs. 30-Year Borrowers
A common borrowing scenario involves choosing between a 15-year and a 30-year term. Comparing the two loan terms highlights a key refinance trade-off. A 15-year loan requires larger monthly payments but saves significantly on interest over time. That interest advantage carries over to refinancing: because 15-year borrowers pay down principal faster, they recoup their refinancing costs much sooner than 30-year borrowers.
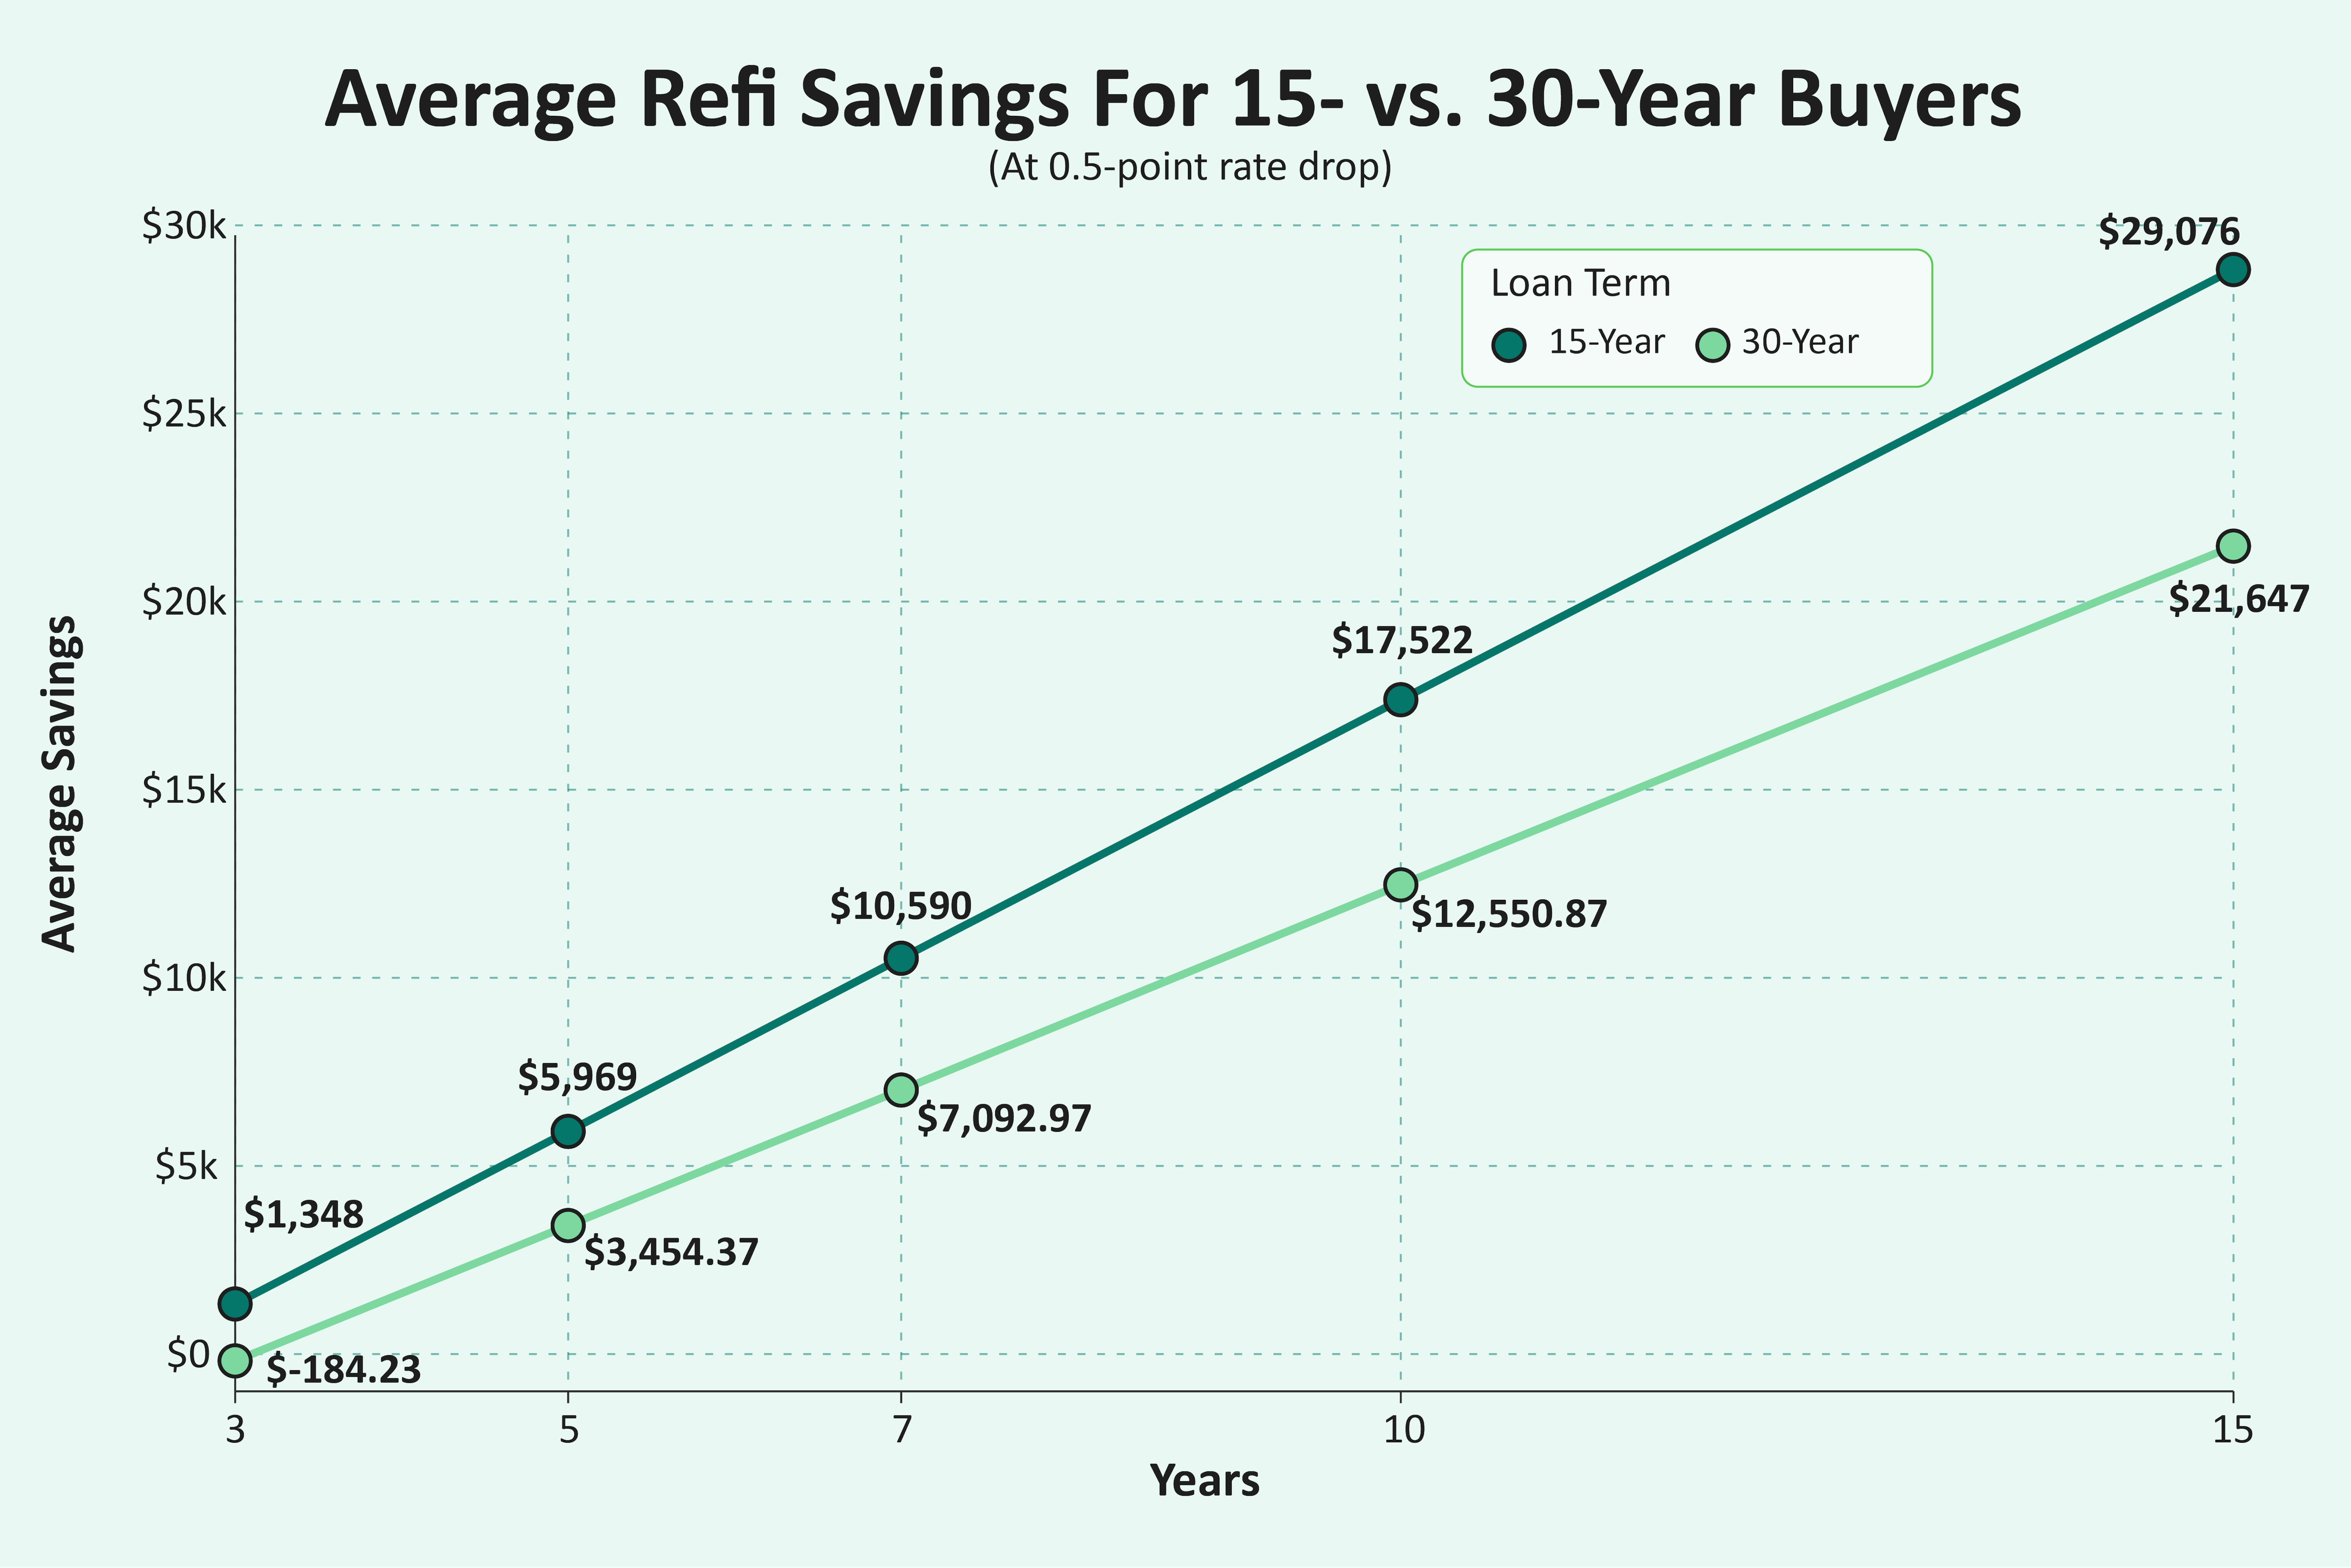
This example illustrates that 15-year refinancers accrue savings much more quickly than 30-year borrowers. In the first three years, the shorter-term loan already yields a modest net gain (about $1,350), while the 30-year borrower remains slightly underwater (–$184). By year seven, the 15-year holder has banked nearly $10,600, roughly $3,300 more than the amount saved by the 30-year borrower.
That advantage grows over time: at year 15, the 15-year refinance has saved about $29,100 compared to $21,650 for the 30-year. By year 30, the difference between them is more than $8,400 ($29,076 vs. $21,647).
15- vs. 30-Year Break-Even Periods
Borrowers with 15-year terms also break even much sooner than 30-year borrowers. Because shorter mortgage terms start with higher monthly payments and faster principal payoff, each rate cut reduces their payment by more dollars. In contrast, 30-year borrowers enjoy lower monthly payments but pay down principal more slowly, which lengthens their break-even horizon and means more paid in interest.
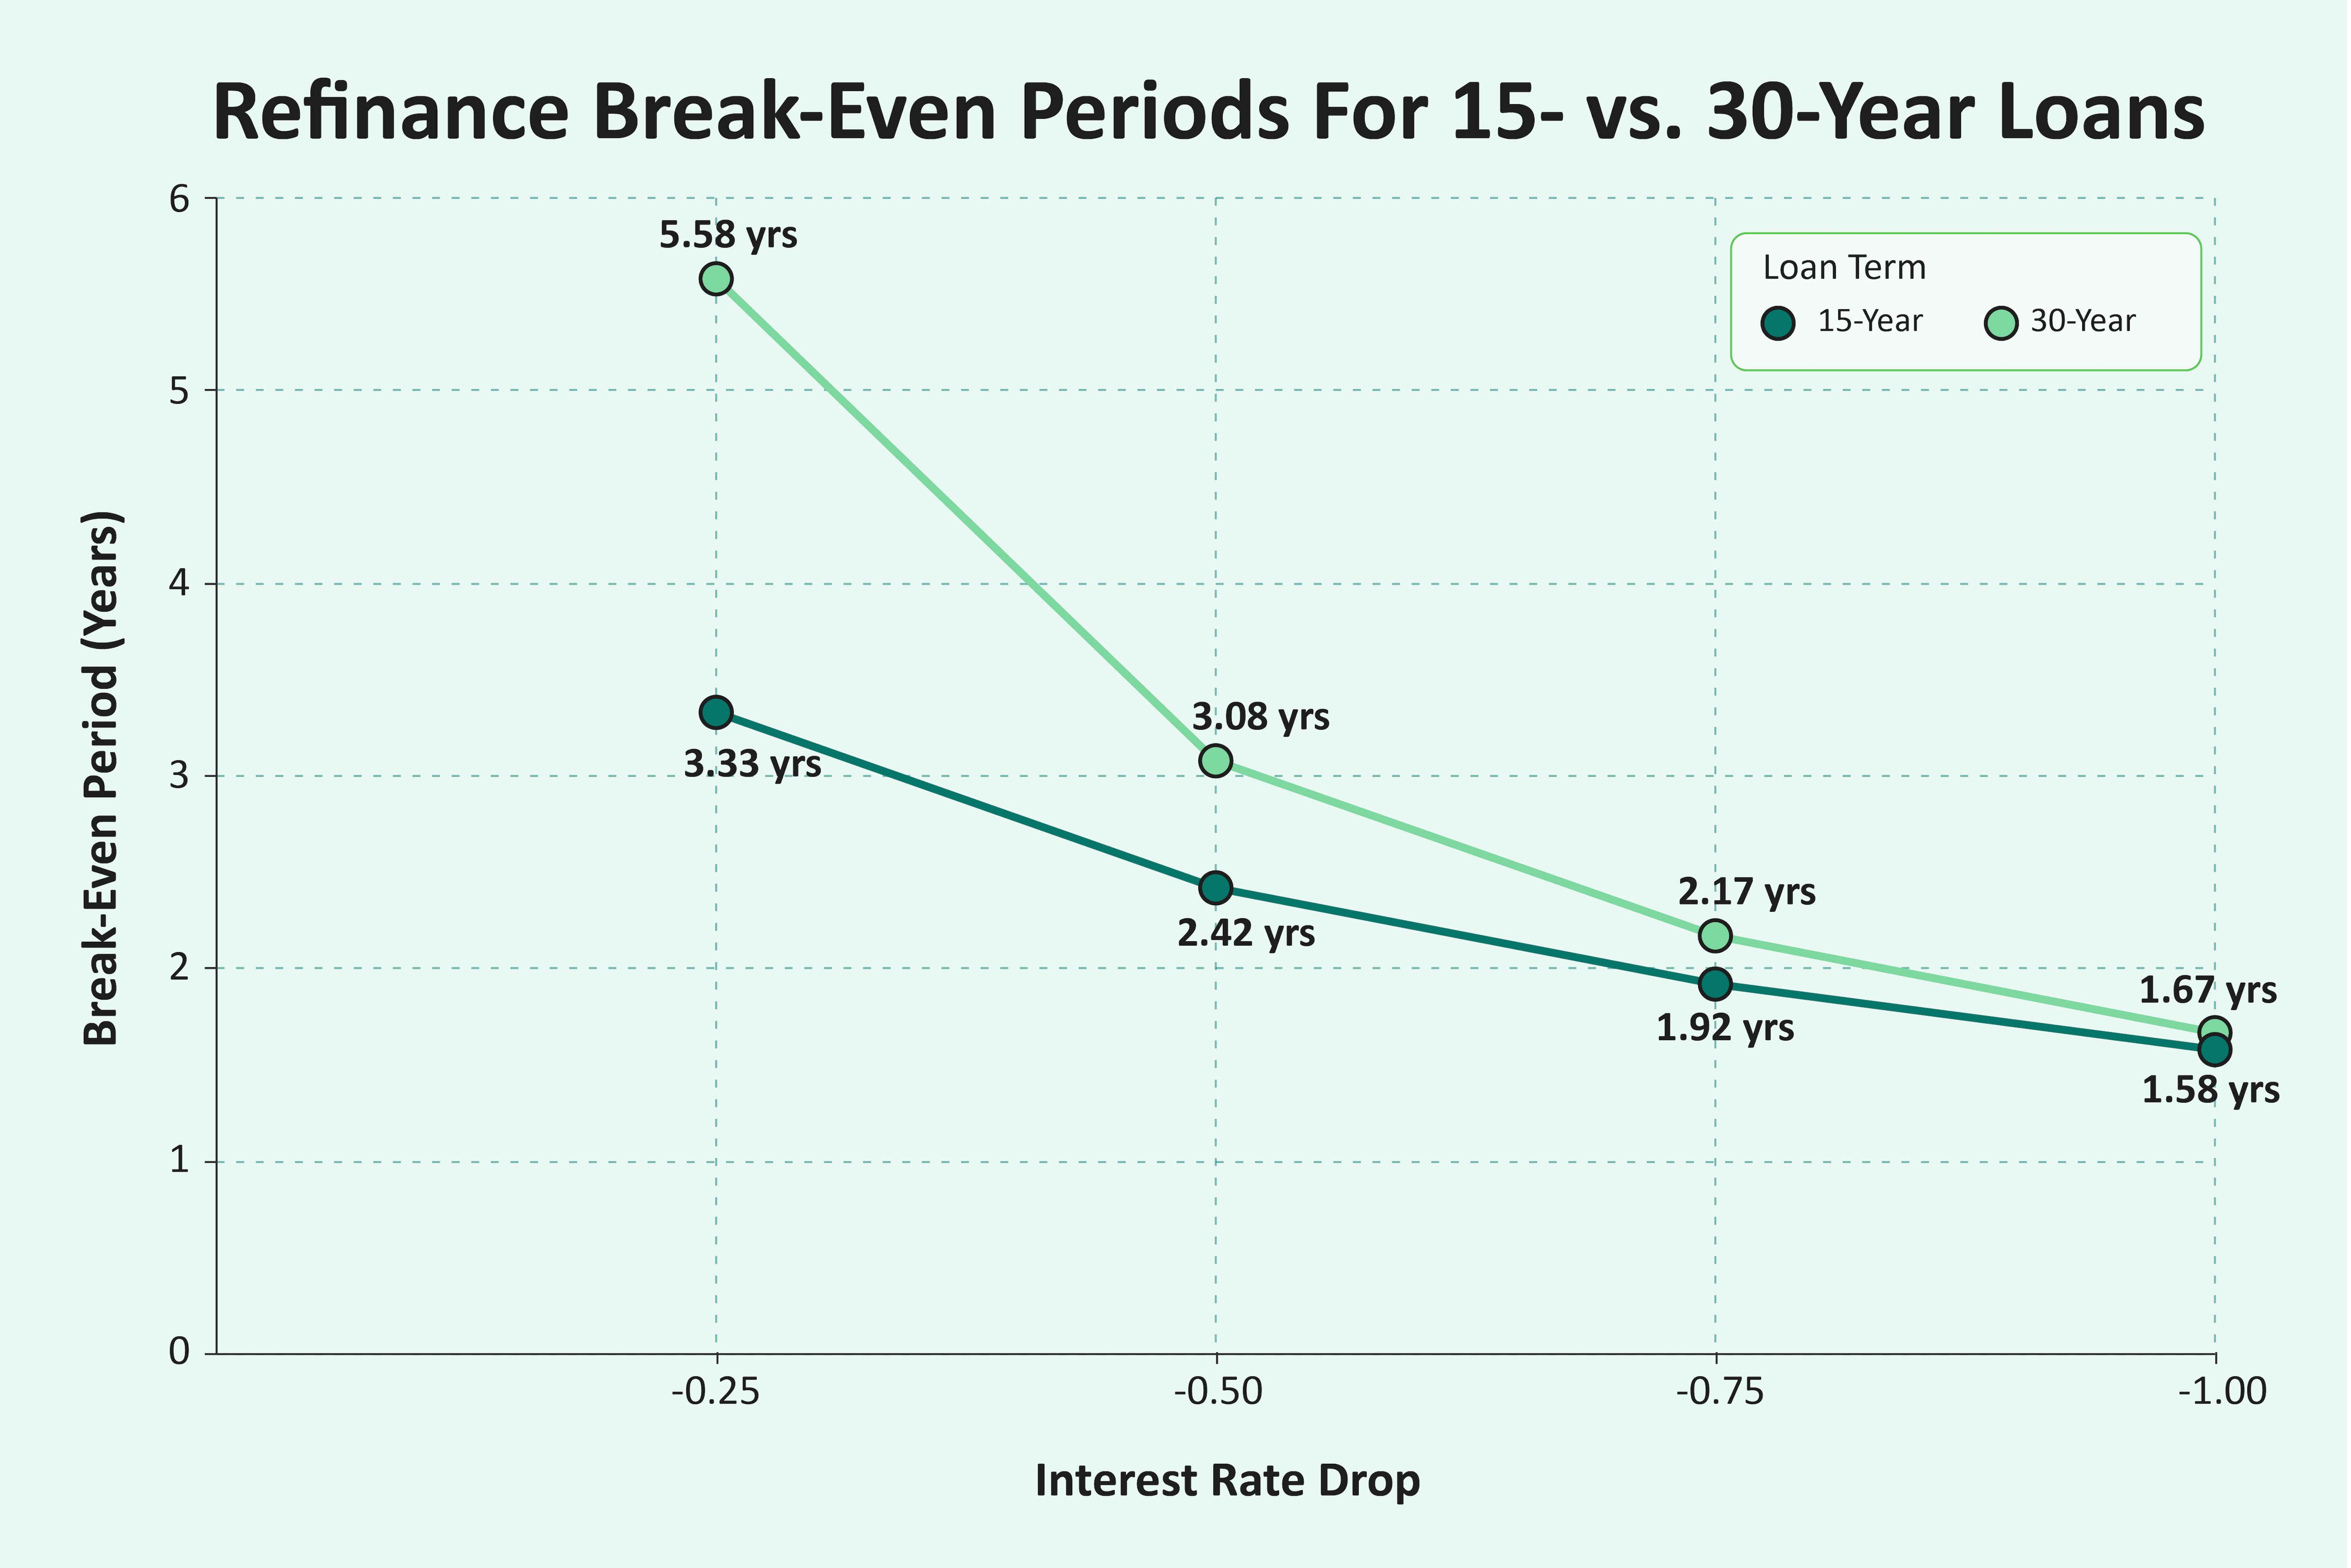
Like refinance savings, the break-even points are also cut in half for 15-year borrowers.
In this example, based on a 0.25 percentage point rate drop and a 20% down payment, 30-year borrowers take 5.5 years to break even, while 15-year borrowers break even in just 3.3 years.
Refi Savings For Conventional vs. Government-Backed Loans
Conventional mortgages remain the most popular mortgage choice, but government-backed loans are gaining traction, especially among first-time buyers who may be more reliant on lower down-payment requirements and easier qualification standards.
With a government-backed loan, borrowers trade smaller upfront costs for higher interest expenses over the life of the loan. With a refinance, that trade-off carries through: conventional borrowers generally realize greater long-term savings, while government-backed borrowers see more upfront relief but smaller cumulative gains. Below, we compare how refinance savings with a 0.5-point drop unfold for each loan type over time:
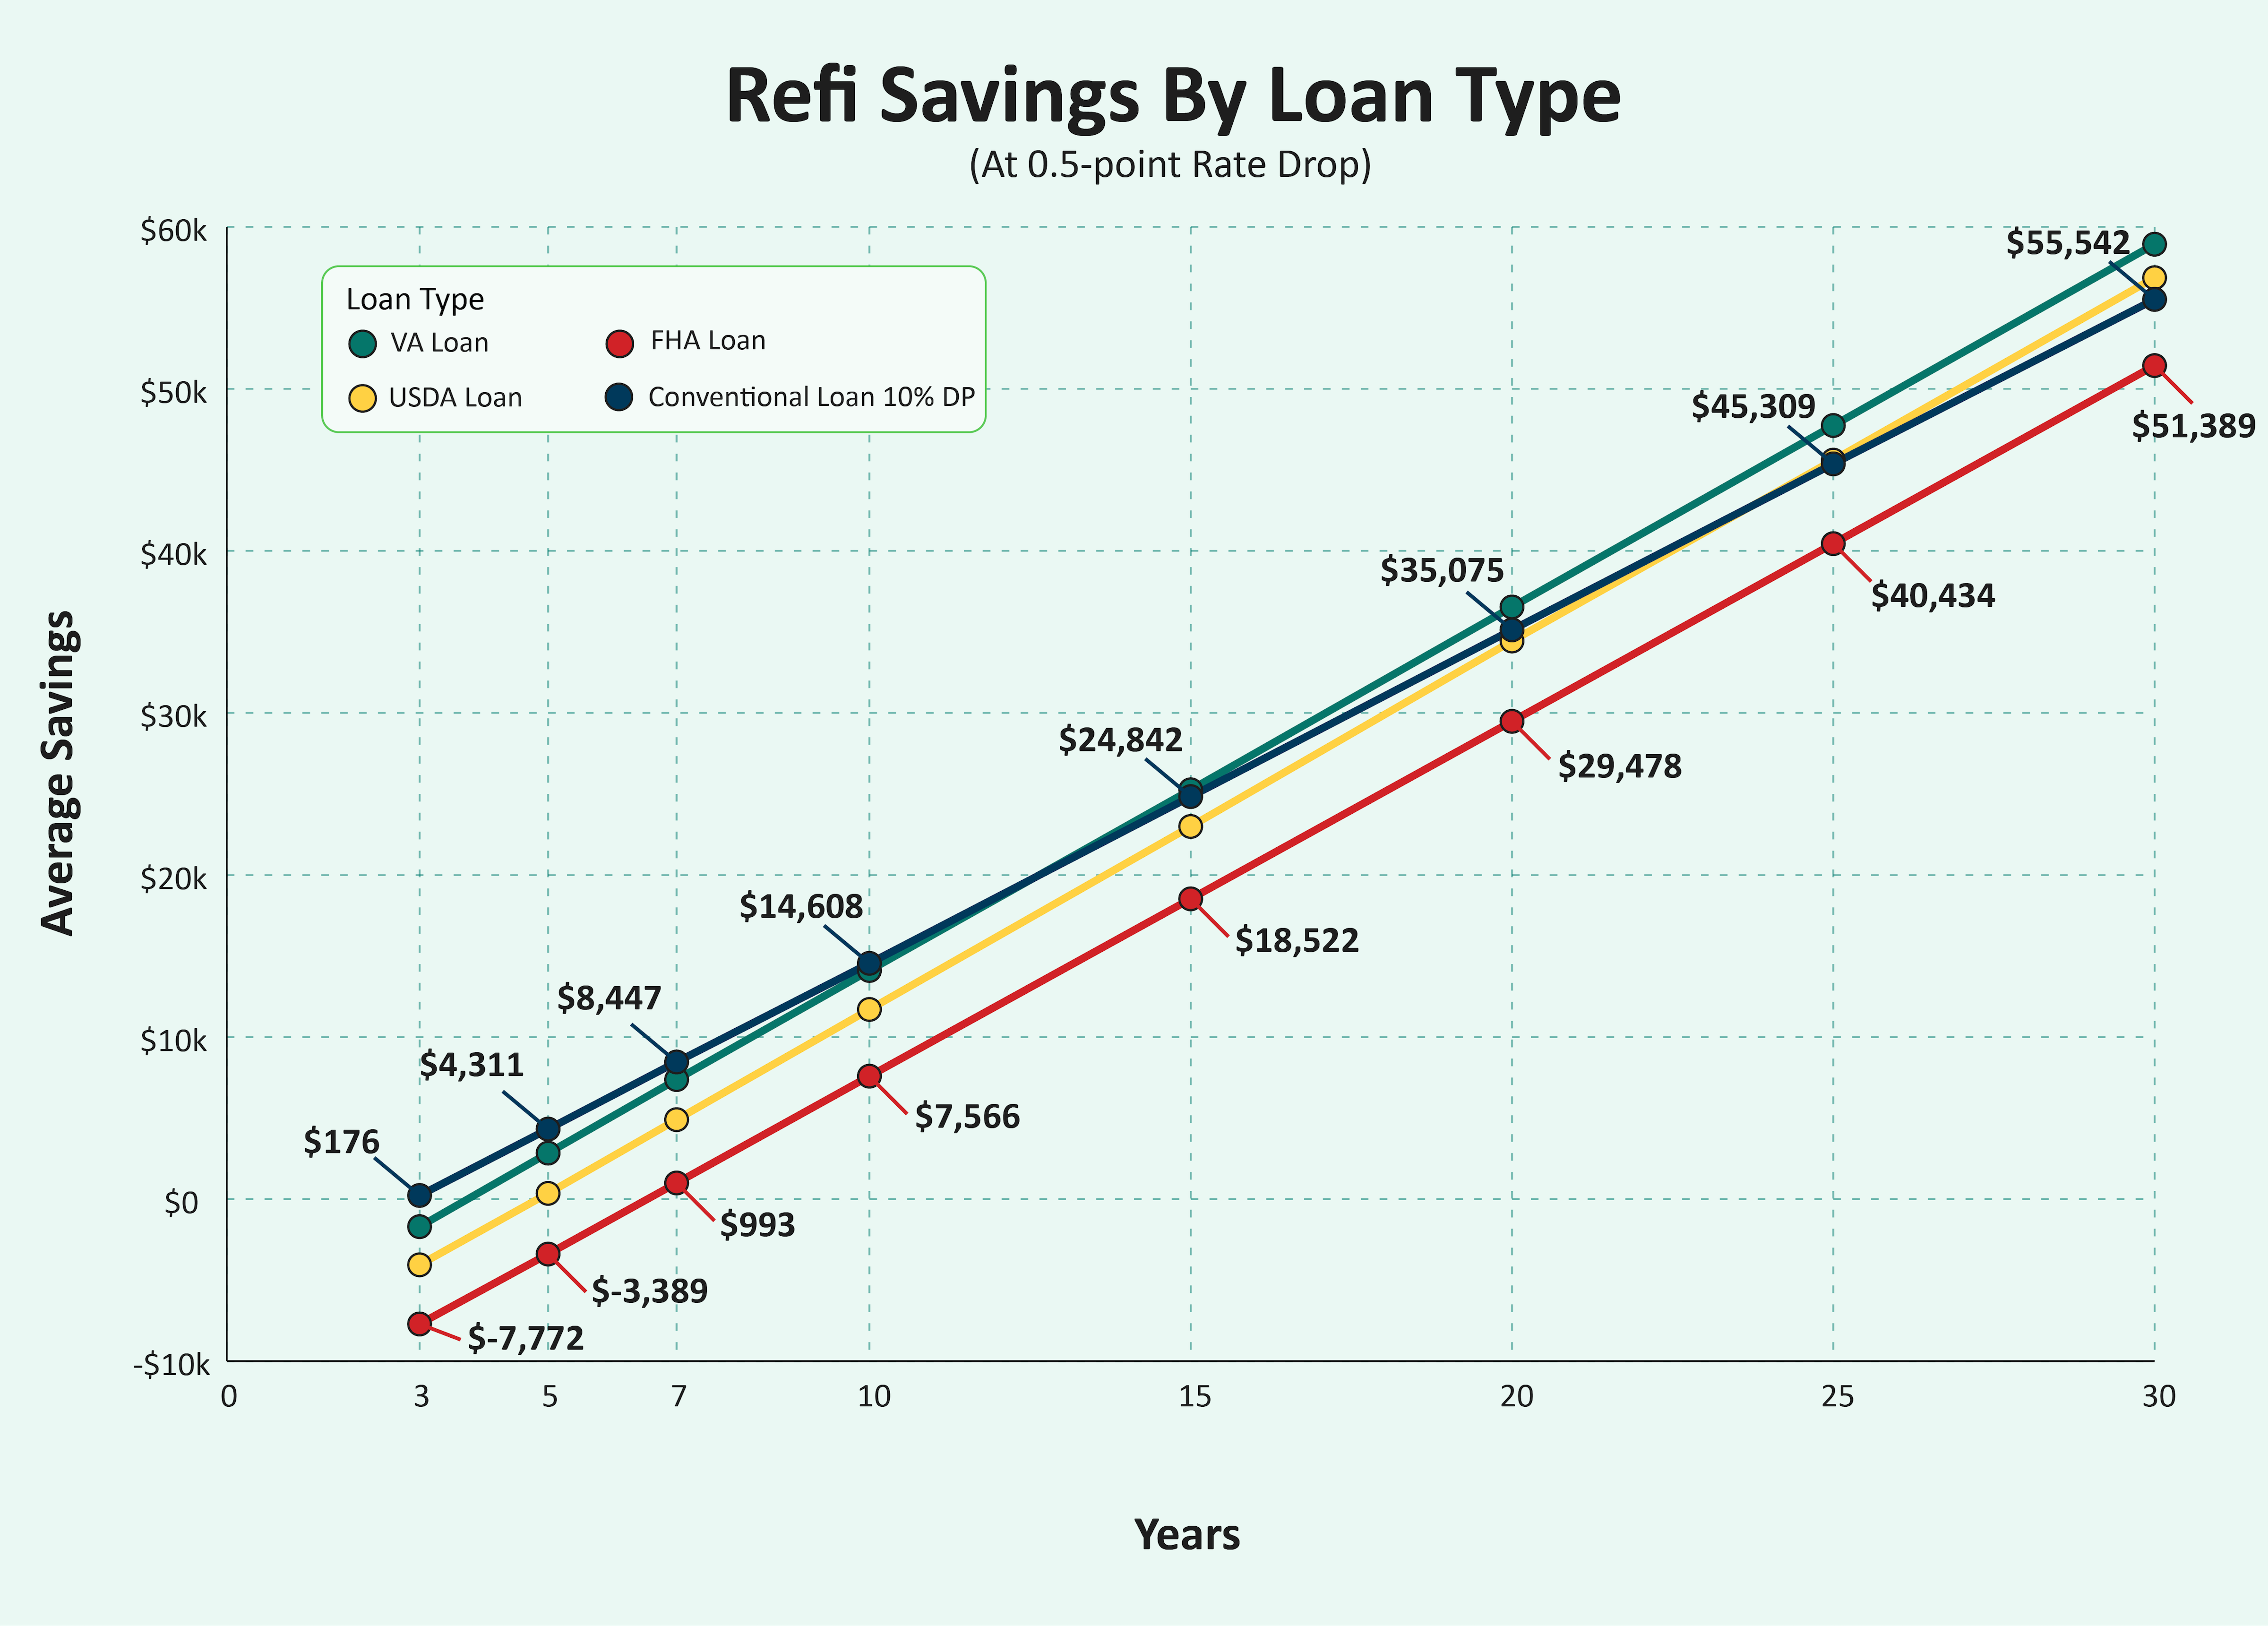
Note: Each scenario assumes the borrower refinances into the same loan type they started with (e.g., VA to VA, conventional to conventional). For government-backed loans, we assumed the minimum down payment: 0% for VA and USDA, and 3.5% for FHA.
Across every program, deeper rate cuts yield larger net savings at each horizon. For example, a VA borrower sees roughly $4,175 in positive net savings after three years with a full-point drop, whereas an FHA borrower still loses about $2,111 in that same window.
By year 10, even FHA borrowers with a 0.75-point drop turn a profit (about $17,058), though conventional and VA borrowers reach profitability much sooner and accumulate tens of thousands in savings over 15–30 years.
Why Government-Backed Loans Take Longer To See Refi Savings
Government-backed mortgages include upfront and ongoing insurance or guarantee fees. Conventional loans also have insurance costs, but those can usually be canceled once the borrower reaches 20% equity.
FHA loans charge a 1.75% upfront fee and a monthly MIP for the life of the loan, while USDA loans charge a 1% guarantee fee and an annual fee (0.35% of balance). VA loans require a one-time funding fee but no monthly insurance.
In contrast, conventional borrowers who refinance with any amount of equity below 20% must pay only pay ongoing mortgage insurance until that number of equity is reached, allowing them to recover refinance costs in as little as 1.58 years under a full-point rate drop—over two years faster than a similarly situated FHA borrower.
Average Break-Even Periods By Loan Type
Our study found that break-even periods also vary greatly by loan type.
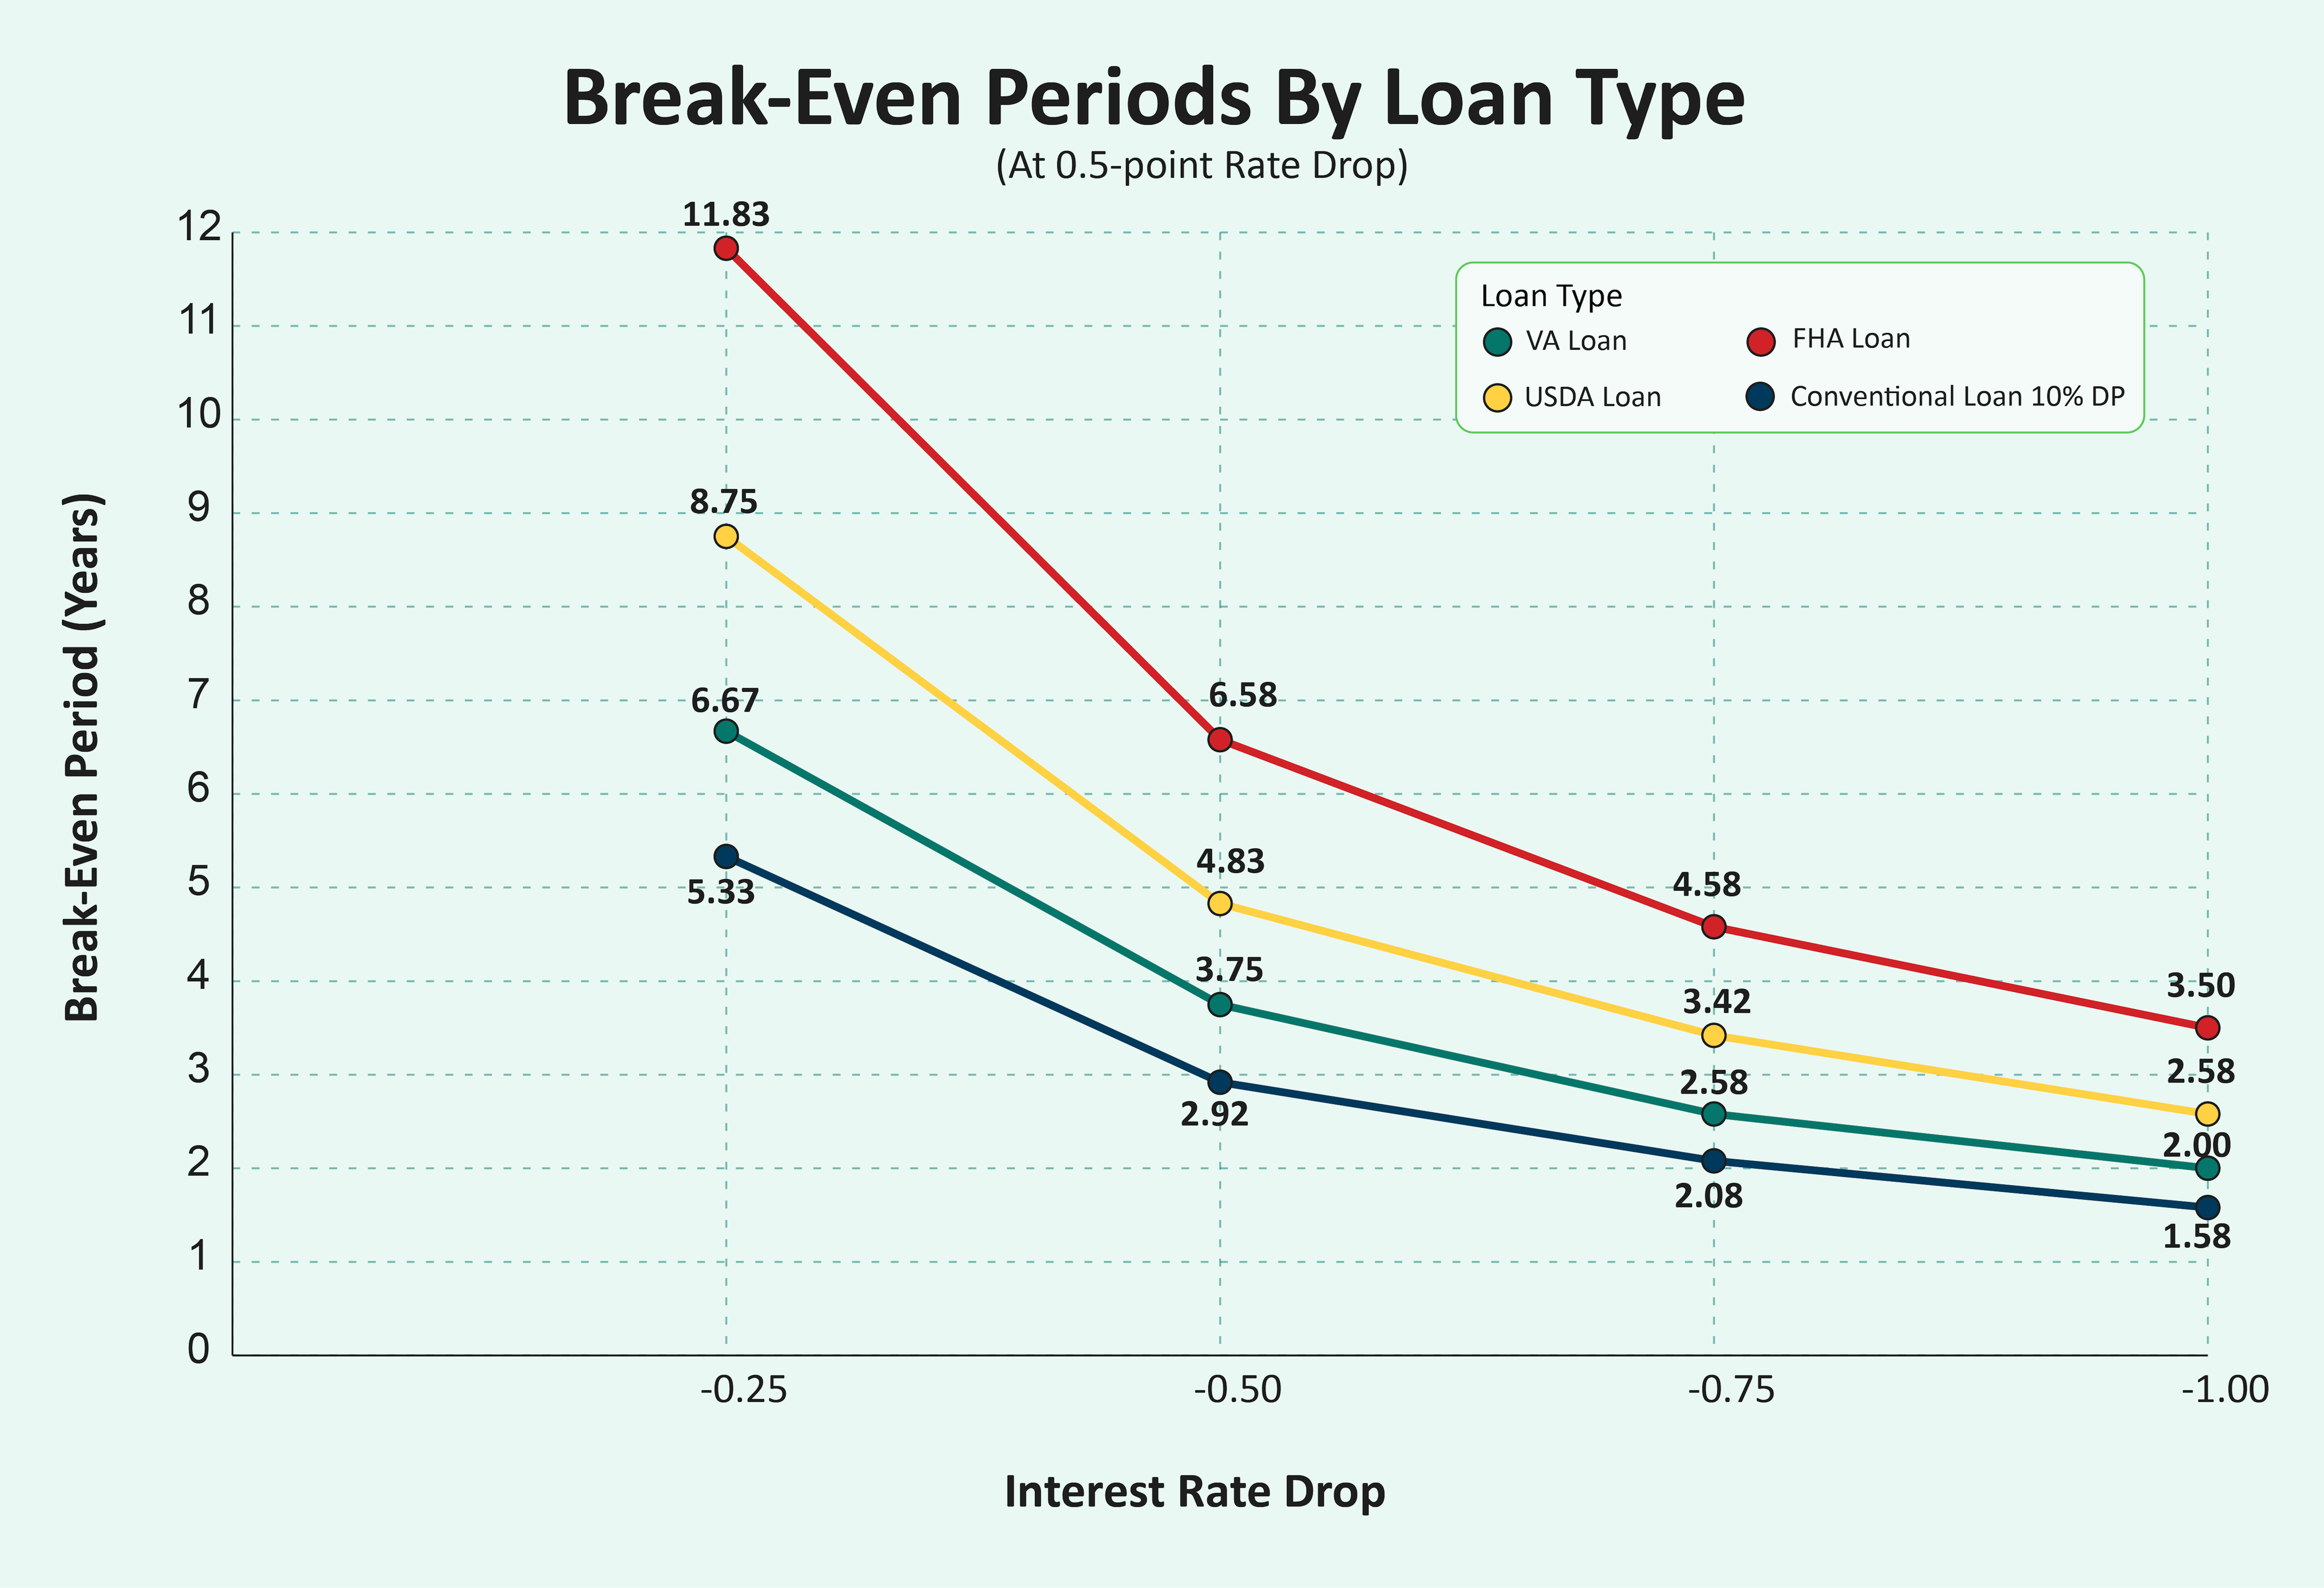
At just a 0.25-point rate drop, a conventional borrower with a 10% down payment breaks even in about 5.33 years, while a 30-year VA borrower needs roughly 6.67 years, a USDA borrower about 8.75 years, and an FHA borrower over 11.83 years.
With larger rate drops, all loan types break even sooner, but FHA is still the slowest. Even with a full-point drop, FHA borrowers wait 3.50 years, compared to 1.58 years for conventional loans, 2.00 years for VA, and 2.58 years for USDA. This is unsurprising considering that FHA loans have the highest fees (1.75% at closing and typically 0.55% annually for most borrowers).
Average Refinance Savings By State
Variations in average loan size, property taxes, insurance premiums, and closing costs drive significant differences in refinance savings from state to state. We modeled a scenario with a 0.5-point rate drop to see how homebuyers in different states would fare.
The results were striking: Only 10 states recouped their refinancing costs within three years, while homeowners in the other 40 states remained, on average, at least $100 underwater.
Average Refinance Savings By State (0.5 rate reduction)
| State | Years to Break-Even | Savings after 3 Years | Savings after 5 Years |
|---|---|---|---|
| New Hampshire | 2.8 | $316 | $4,103 |
| Colorado | 2.8 | $295 | $4,712 |
| California | 2.8 | $405 | $6,553 |
| Washington | 2.9 | $223 | $5,047 |
| District of Columbia | 2.9 | $231 | $6,766 |
| Hawaii | 2.9 | $200 | $6,488 |
| Missouri | 2.9 | $72 | $2,424 |
| Montana | 3 | $52 | $3,773 |
| Utah | 3 | $54 | $4,087 |
| Alaska | 3 | $71 | $3,412 |
| Arizona | 3 | -$9 | $3,650 |
| Vermont | 3.1 | -$114 | $3,260 |
| Maryland | 3.1 | -$164 | $3,605 |
| Wyoming | 3.1 | -$148 | $2,709 |
| Idaho | 3.2 | -$232 | $3,166 |
| National | 3.2 | -$257 | $3,144 |
| Georgia | 3.2 | -$263 | $2,942 |
| Maine | 3.2 | -$282 | $2,828 |
| Rhode Island | 3.2 | -$362 | $3,441 |
| Indiana | 3.3 | -$235 | $2,091 |
| Oregon | 3.3 | -$417 | $3,413 |
| North Carolina | 3.3 | -$343 | $2,755 |
| Nevada | 3.3 | -$453 | $3,237 |
| Texas | 3.3 | -$391 | $2,765 |
| Kentucky | 3.3 | -$290 | $1,984 |
| Kansas | 3.3 | -$310 | $2,070 |
| Virginia | 3.3 | -$526 | $3,187 |
| Massachusetts | 3.3 | -$713 | $4,230 |
| North Dakota | 3.3 | -$384 | $2,128 |
| Alabama | 3.3 | -$391 | $1,908 |
| South Carolina | 3.3 | -$517 | $2,407 |
| Florida | 3.3 | -$631 | $2,897 |
| South Dakota | 3.3 | -$488 | $2,222 |
| Minnesota | 3.4 | -$511 | $2,289 |
| New York | 3.4 | -$858 | $3,437 |
| Delaware | 3.4 | -$624 | $2,443 |
| Pennsylvania | 3.5 | -$575 | $2,027 |
| Wisconsin | 3.5 | -$613 | $2,050 |
| Oklahoma | 3.5 | -$524 | $1,703 |
| Arkansas | 3.5 | -$543 | $1,723 |
| Iowa | 3.5 | -$474 | $1,498 |
| New Mexico | 3.5 | -$578 | $1,807 |
| Nebraska | 3.5 | -$603 | $1,840 |
| Tennessee | 3.6 | -$812 | $2,387 |
| Mississippi | 3.6 | -$558 | $1,408 |
| Ohio | 3.6 | -$700 | $1,653 |
| New Jersey | 3.7 | -$1,299 | $3,002 |
| Michigan | 3.9 | -$749 | $1,547 |
| West Virginia | 4.1 | -$861 | $1,144 |
| Illinois | 4.1 | -$1,449 | $1,215 |
| Louisiana | 4.1 | -$1,195 | $1,028 |
| Connecticut | 4.1 | -$1,971 | $1,563 |
Every state eventually breaks even within five years, but the size of the savings depends greatly on location. For example, New Hampshire borrowers, who have an average borrowing amount of $430,247, see nearly $3,000 more in five-year savings after refinancing at a 0.5-point rate drop than homeowners in Louisiana, who have an average loan amount of $252,075.
States With the Best Refinance Savings Over 5 Years
Here’s a look at the states that offer the highest net savings over 5 years using the same 0.5-point rate reduction scenario:
Top States for Refinance Savings (After 5 Years)
| State | 5-Year Savings | Notes |
|---|---|---|
| District of Columbia | $6,766 | Highest 5-year savings, but takes just under 3 years to break even at 35 months. |
| California | $6,553 | 3rd highest 5-year savings, despite having high property taxes and HOI costs. |
| Hawaii | $6,488 | Despite a very high average loan ($714k), Hawaii has the lowest average HOI cost in the U.S. |
| Washington | $5,047 | 4th highest 5-year savings and breaks even just under 3 years. |
| Colorado | $4,712 | High property value but relatively moderate title/origination fees. |
It’s no surprise these states have the highest refinance savings, since they also have some of the most expensive housing markets in the country. This means higher mortgage payments and bigger dollar savings when refinancing.
These differences underscore how local market conditions, from home prices to tax rates, can affect whether and when refinancing makes sense.
Should Prospective Buyers Wait To Buy?
Based on our analysis, waiting for a modest rate drop may not pay off quickly enough to justify delaying a home purchase. Our data indicates that only rate cuts of roughly 0.6 percentage points or more offer meaningful savings within a reasonable timeframe for typical 2025 buyers. Even a half-point decrease takes over three years (37 months) to become neutral, and nearly four years before homeowners see a net gain. First-time homebuyers and those using low down payment options would need to wait even longer to start recouping savings. In other words, modest rate improvements still require a multi-year commitment before refinancing truly offsets
This doesn’t mean buyers should rush in, but those planning to stay in their homes for at least three to five years may not benefit from delaying a purchase for a small rate drop. Only a substantial drop of 0.75 percentage points or more reduces the payoff period to under three years, and a full percentage point cut can deliver net savings in less than two.
For those planning to stay in their home for at least five years, locking in today’s rate might be the smarter choice for long-term savings.
Methodology
The Neighbors Bank 2025 Mortgage Refinance Study used multiple public and proprietary data sources to model break-even periods and net savings.
Sources included NerdWallet, Tax Foundation, 2024 HMDA filings, the FRED series for 30- and 15-year conventional, 30-year VA, 30-year USDA, and 30-year FHA mortgages, 2023 ACS 5-year estimates, and U.S. Census Bureau data.
Interest Rates: The national average 30- and 15-year conventional loan mortgage rates were determined by averaging the weekly national mortgage rates via FRED from January 2, 2025, to July 17, 2025. The national average 30-year USDA, 30-year FHA, and 30-year VA loan mortgage rates were determined by averaging the daily national mortgage rates via FRED from January 2, 2025, to July 30, 2025. 6.13% interest rate taken from Mortgage News Daily for September 16th. We assumed that no interest rate discount points were purchased at the original home purchase or refinance.
Loan Amount & Down Payments: The national average loan amount and down payment values were taken from 2024 HMDA filings. Calculations for conventional PMI assumed cancellation at 20% equity.
Closing Costs: Closing costs for conventional loan refinances included an origination fee of 0.75%, a state-specific value for titling fees, and a $600 appraisal. For HOI and property taxes, we took an average of the values across all 50 states. For government-backed refinance costs, the same origination and titling fees applied, but we removed the appraisal assumption and added any one-time fees, such as an upfront MIP or guarantee fees. Additionally, we assumed that the associated costs were paid out of pocket by the borrower at the time of refinance, not rolled into the loan.
Mortgage Insurance & Government-Backed Loan Fees: When we analyzed data for conventional loans with less than 20% equity at closing, we assumed a private mortgage insurance fee of 0.75%. USDA loans require a 0.35% annual fee. The VA loan funding fee also varies depending on the down payment provided at closing and whether it is a borrower’s first or subsequent use; we assumed 0.5%, the standard fee for VA streamline refinances. FHA loans require a 1.75% upfront fee and an ongoing premium that varies depending on the loan amount and down payment. For our analysis, we assumed the most common annual FHA MIP fee of 0.55%.
Break-Even Periods: When calculating the breakeven period for all scenarios, we assumed seven months of payments before the simulated rate drops and added the amount of equity gained accordingly to the new, refinanced loan amounts. The break-even calculation was the difference in monthly savings of the new monthly mortgage payment divided by the total cost of refinancing. The break-even period only takes into account recouping the cost of the refinance, not changes in PMI. Totally breaking even, including both refinance costs and changes in PMI, may take longer than the stated number of months.
Average Savings: The refinance cost savings were determined by accounting for the savings in monthly payments after applying a rate drop, as well as the removal or reduction of mortgage insurance over certain loan periods.
Monthly Mortgage Payment Assumption: We assumed that borrowers have made at least one mortgage payment prior to refinancing, even though typical loan structures delay the first payment until the second month after closing (e.g., a loan closed on August 3rd would have a first payment due October 1st). This one-month adjustment allows us to reflect a modest amount of equity buildup and ensures consistency across loan scenarios, simplifying comparisons regardless of the actual closing month.
Refinance Seasoning Assumption: Some government‑backed mortgage programs impose seasoning requirements that restrict borrowers from refinancing within the first 12 months of the loan. These rules can temporarily limit a homeowner’s ability to take advantage of falling rates. For the purposes of this analysis, we did not apply a seasoning assumption, as the primary goal was to isolate the broader market dynamics and borrower impacts of falling rates, regardless of short‑term programmatic restrictions that vary by loan type.
Additional Sources