In today’s housing market, even the term “affordable” feels like a relic of the past. Mortgage rates have climbed from historic lows (sub-3% during the peak of the COVID pandemic) to more than double that (6.5% in 2025) in just a matter of years. Meanwhile, inflation and persistent inventory shortages have pushed home prices to record highs. In many parts of the country, the average buyer needs more money than ever to make a competitive offer on a livable home.
But here’s the problem: When we talk about “the housing market,” we tend to treat it as a monolith. In reality, the U.S. housing market is a patchwork of vastly different local conditions.
While headlines often spotlight affordability issues in big cities, a parallel crisis is quietly unfolding in rural America, with fewer resources and far less visibility.
What Do We Mean By “Rural?”
In simple terms, “rural” is any area outside a major metropolitan area or MSA. Rural regions are often characterized by small towns, farming communities and vast distances between services.
Rural communities are estimated to make up nearly 97% of the total U.S. land area, yet they’re home to only about 19% of the population, roughly 60 million Americans*. In other words, the vast majority of the U.S. is inhabited by a relatively small share of the population.
For the purposes of our data methodology, we considered rural counties as those with a population of 20,000 or less due to the similarities among these groups in housing inventory, median household income, the number of banks in the area and the level of housing burden.
Despite their geographic diversity, rural Americans face strikingly similar barriers to homeownership, and those barriers are only growing in 2025.
The Reality of Rural Homebuying in 2025
While rural homes often carry lower price tags, buying in these areas isn’t always easy.
Rural markets are beginning to behave like their urban counterparts: homes are selling quickly, inventory is evaporating and buyers are competing for a shrinking pool of livable properties. But unlike their urban peers, rural buyers lack the income levels, mortgage flexibility and infrastructure needed to keep pace.
Let’s take a closer look at the data behind this story.
1. Inventory Problems Aren’t Just a Big-City Thing
Generally, rural areas are in lower demand than urban ones because they offer less convenient access to entertainment and services. But interestingly, when we looked at absorption rates across rural and non-rural areas, which measure the average number of homes sold per month compared to the overall houses listed, the numbers were more similar than expected.
Absorption rate measures the average number of homes sold per month compared to the overall number of houses listed. A balanced or ideal housing market typically exhibits an absorption rate of 15-20%. This range indicates that homes are selling at a steady pace without excessive competition among buyers or a surplus of unsold properties. In such a market, both buyers and sellers can expect a reasonable timeframe for transactions to occur.
Cooler markets–labeled as cold or very cold–typically favor buyers, with ample inventory and less competition. Warmer markets, on the other hand, lean toward sellers. Warm, hot, or very hot conditions signal a seller’s market, where inventory is low and homes move quickly, often sparking bidding wars.
Since 2023, many buyers have become familiar with these hotter conditions, especially in metro areas where competition and low inventory have defined the housing landscape. But when we analyzed absorption rates in rural counties, we found something surprising: the majority of these areas also fell into the warm to hot range. That means even outside of big cities, homes are selling faster than buyers can keep up with, pointing to widespread inventory shortages and heightened demand, even in places traditionally thought of as more balanced or buyer-friendly.
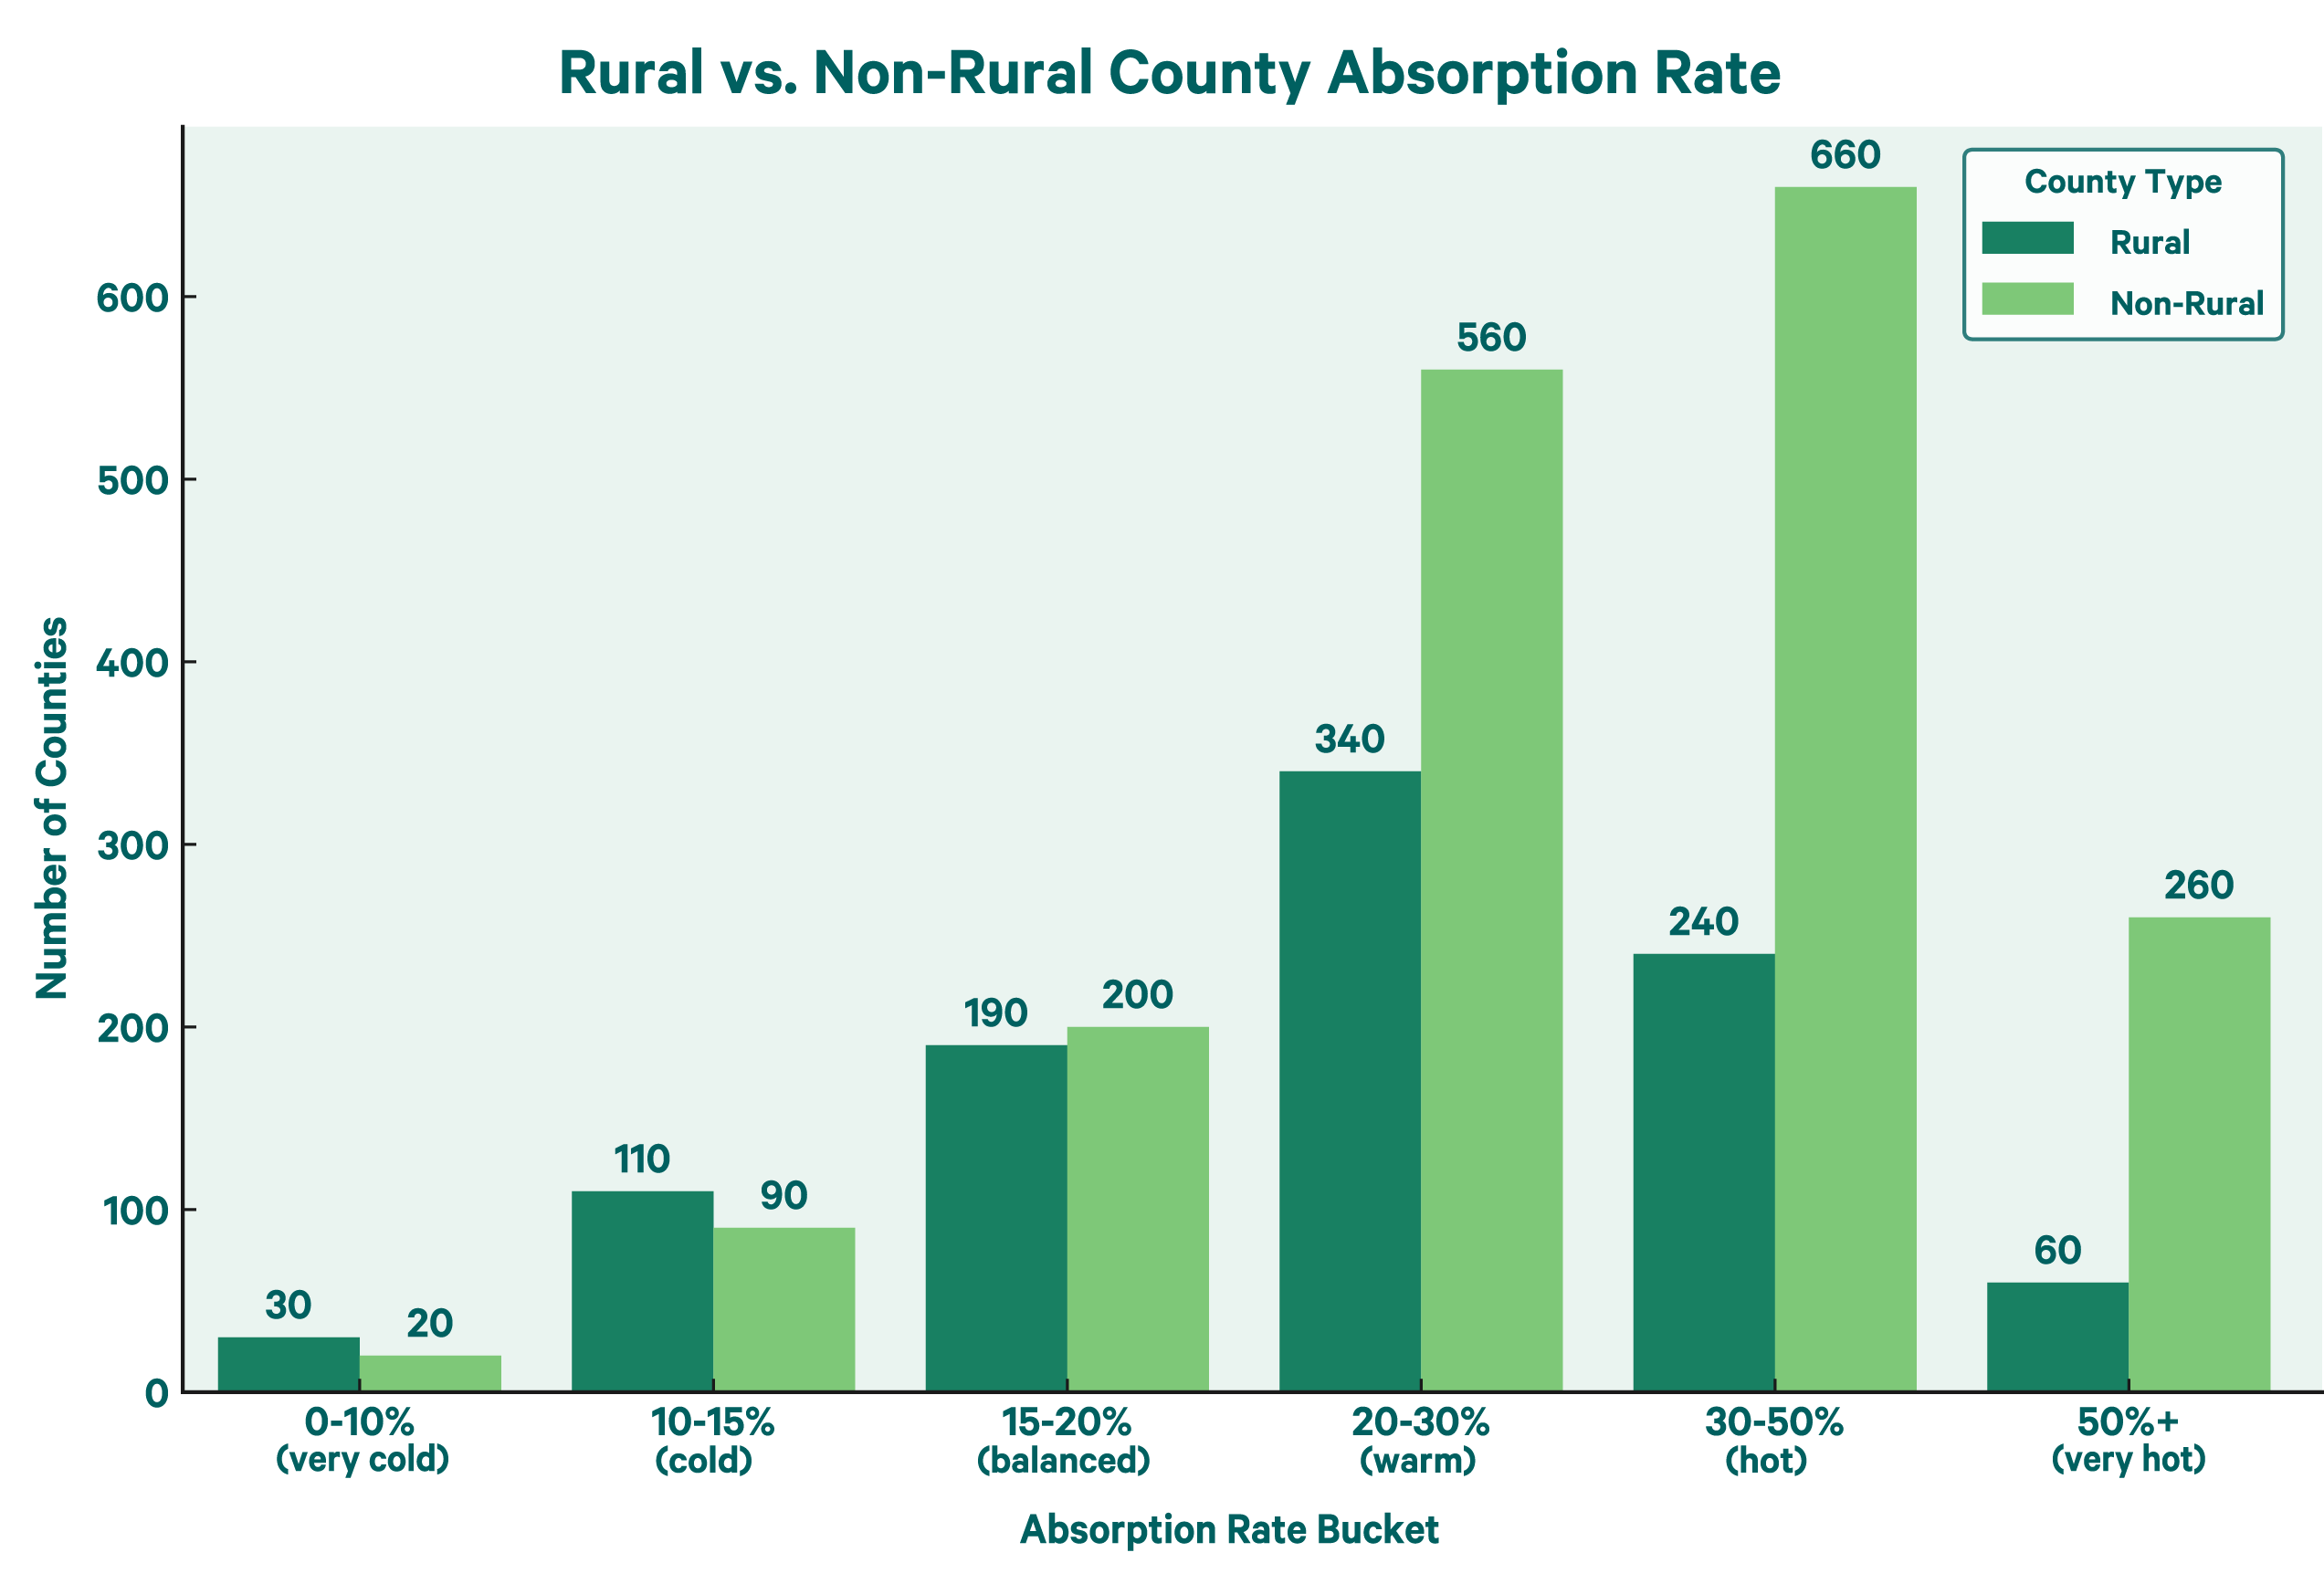
Note: Counties with fewer than 5,000 residents were excluded because their small housing markets can distort absorption rates, making it harder to spot meaningful trends in the data.
This suggests that even limited demand can strain the housing supply in rural markets, especially in areas that saw post-pandemic migration spikes††.
2. Banking Deserts Limit Rural Finance Options
Our study found that the average number of bank branches per county in rural areas is 5.9, compared to 55.1 in urban ones. While rural counties have more branches per 10,000 people, it is important to note that rural counties tend to cover much larger land areas than urban ones, and their banking options are often more limited than those in urban areas.
For example, two banking options in a town of 20,000 people still offer residents only two choices, whereas 20 options in a city of 200,000 people provide residents with a wide array of flexible banking services within their metro area.
Average Number Bank Branches in Rural vs. Non-Rural Areas
| Average Total Branches | Average Branches per 10,000 People | |
|---|---|---|
| Non-Rural | 55.1 | 3.57 |
| Rural | 5.9 | 4.58 |
Many rural counties are considered banking deserts, which the U.S. Census defines as areas lacking bank branches and credit unions within the surrounding 10 miles.‡ These areas greatly limit the options for borrowers seeking face-to-face financial guidance.
Limited access to local banks is one of the indicators the U.S. Department of Agriculture (USDA) uses to determine USDA home loan eligibility. The USDA loan is a government-backed mortgage, insured by the USDA, designed to help low- to moderate-income households purchase homes in eligible rural areas. To ensure the program serves its intended communities, the USDA applies specific criteria, such as limited access to local banks, to define and prioritize underserved regions. This indicates a correlation between the number of bank branches in an area and affordable homebuying options.
3. Affordability Is Slipping—Even Where Prices Are Lower
Renters across all counties face a significantly greater housing burden than homeowners. This challenge isn’t limited to high-cost urban areas. Rural renters also experience high levels of housing unaffordability.
According to the U.S. Department of Housing and Urban Development (HUD), a household is considered housing-burdened when more than 30% of income goes toward housing costs. Our study shows renters are much more likely to exceed this threshold, making it harder to achieve long-term financial goals like homeownership. With so much income going toward rent, saving for a down payment becomes a steep uphill climb.
Despite lower home prices, affordability in rural areas is catching up to urban markets, just in the wrong way.
4. Generational Poverty Makes It Harder to Get Ahead
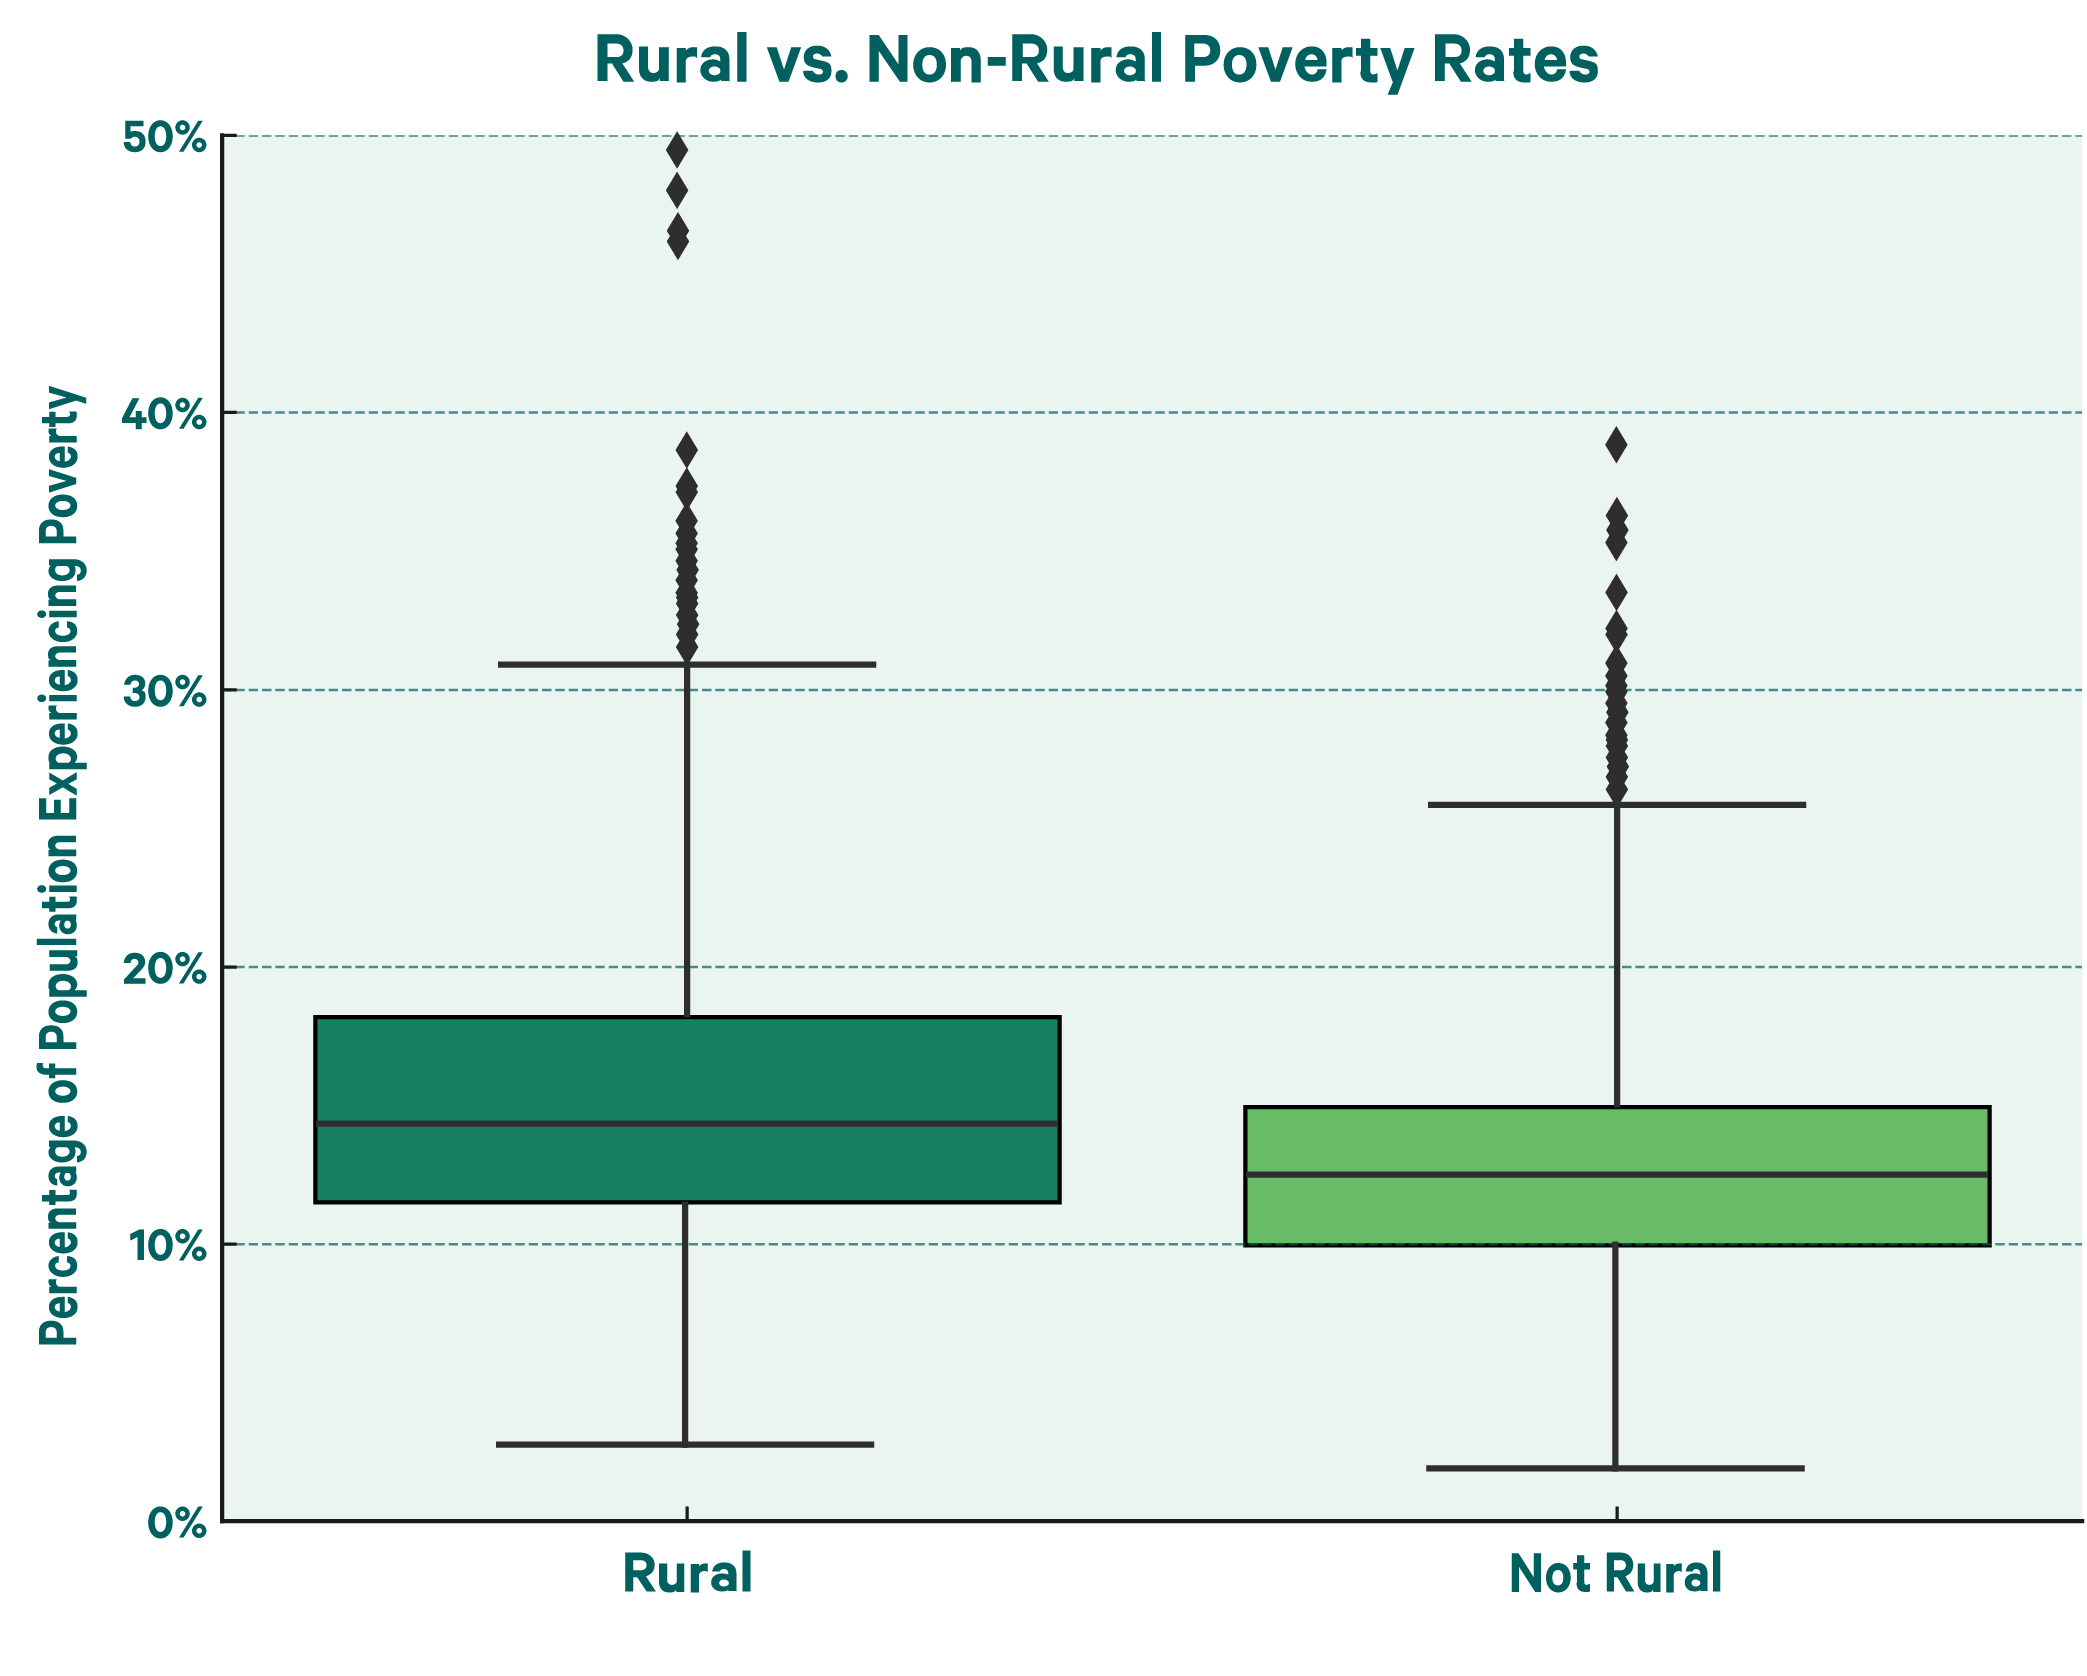
Rural America also has a long history of generational poverty. The U.S. Census tracks areas that experience persistent poverty†, which they define as areas where a significant portion of the population (20% or more) has consistently lived below the poverty line for an extended period, typically 30 years or more. By this definition, there are 353 persistently poor counties in the U.S., and 85% of them (301 counties) are rural.
A closer look at the data reveals that there aren’t just more persistently impoverished rural counties than non-rural counties, but rural counties as a whole also have higher rates of poverty, and they exhibit a wider spread in those rates. As shown in the boxplot below, rural areas have a higher median poverty rate and more extreme outliers, with some counties seeing poverty levels surpassing 40 or almost 50%. The broader range and higher upper quartile in rural counties suggest that poverty is not only more common in rural America, but in many cases, it is also more severe.
Without the possibility of inherited wealth or the availability of family members who can act as co-signers, many rural buyers are locked out of traditional conventional mortgage options.
5. Owning Doesn’t Always Mean Relief
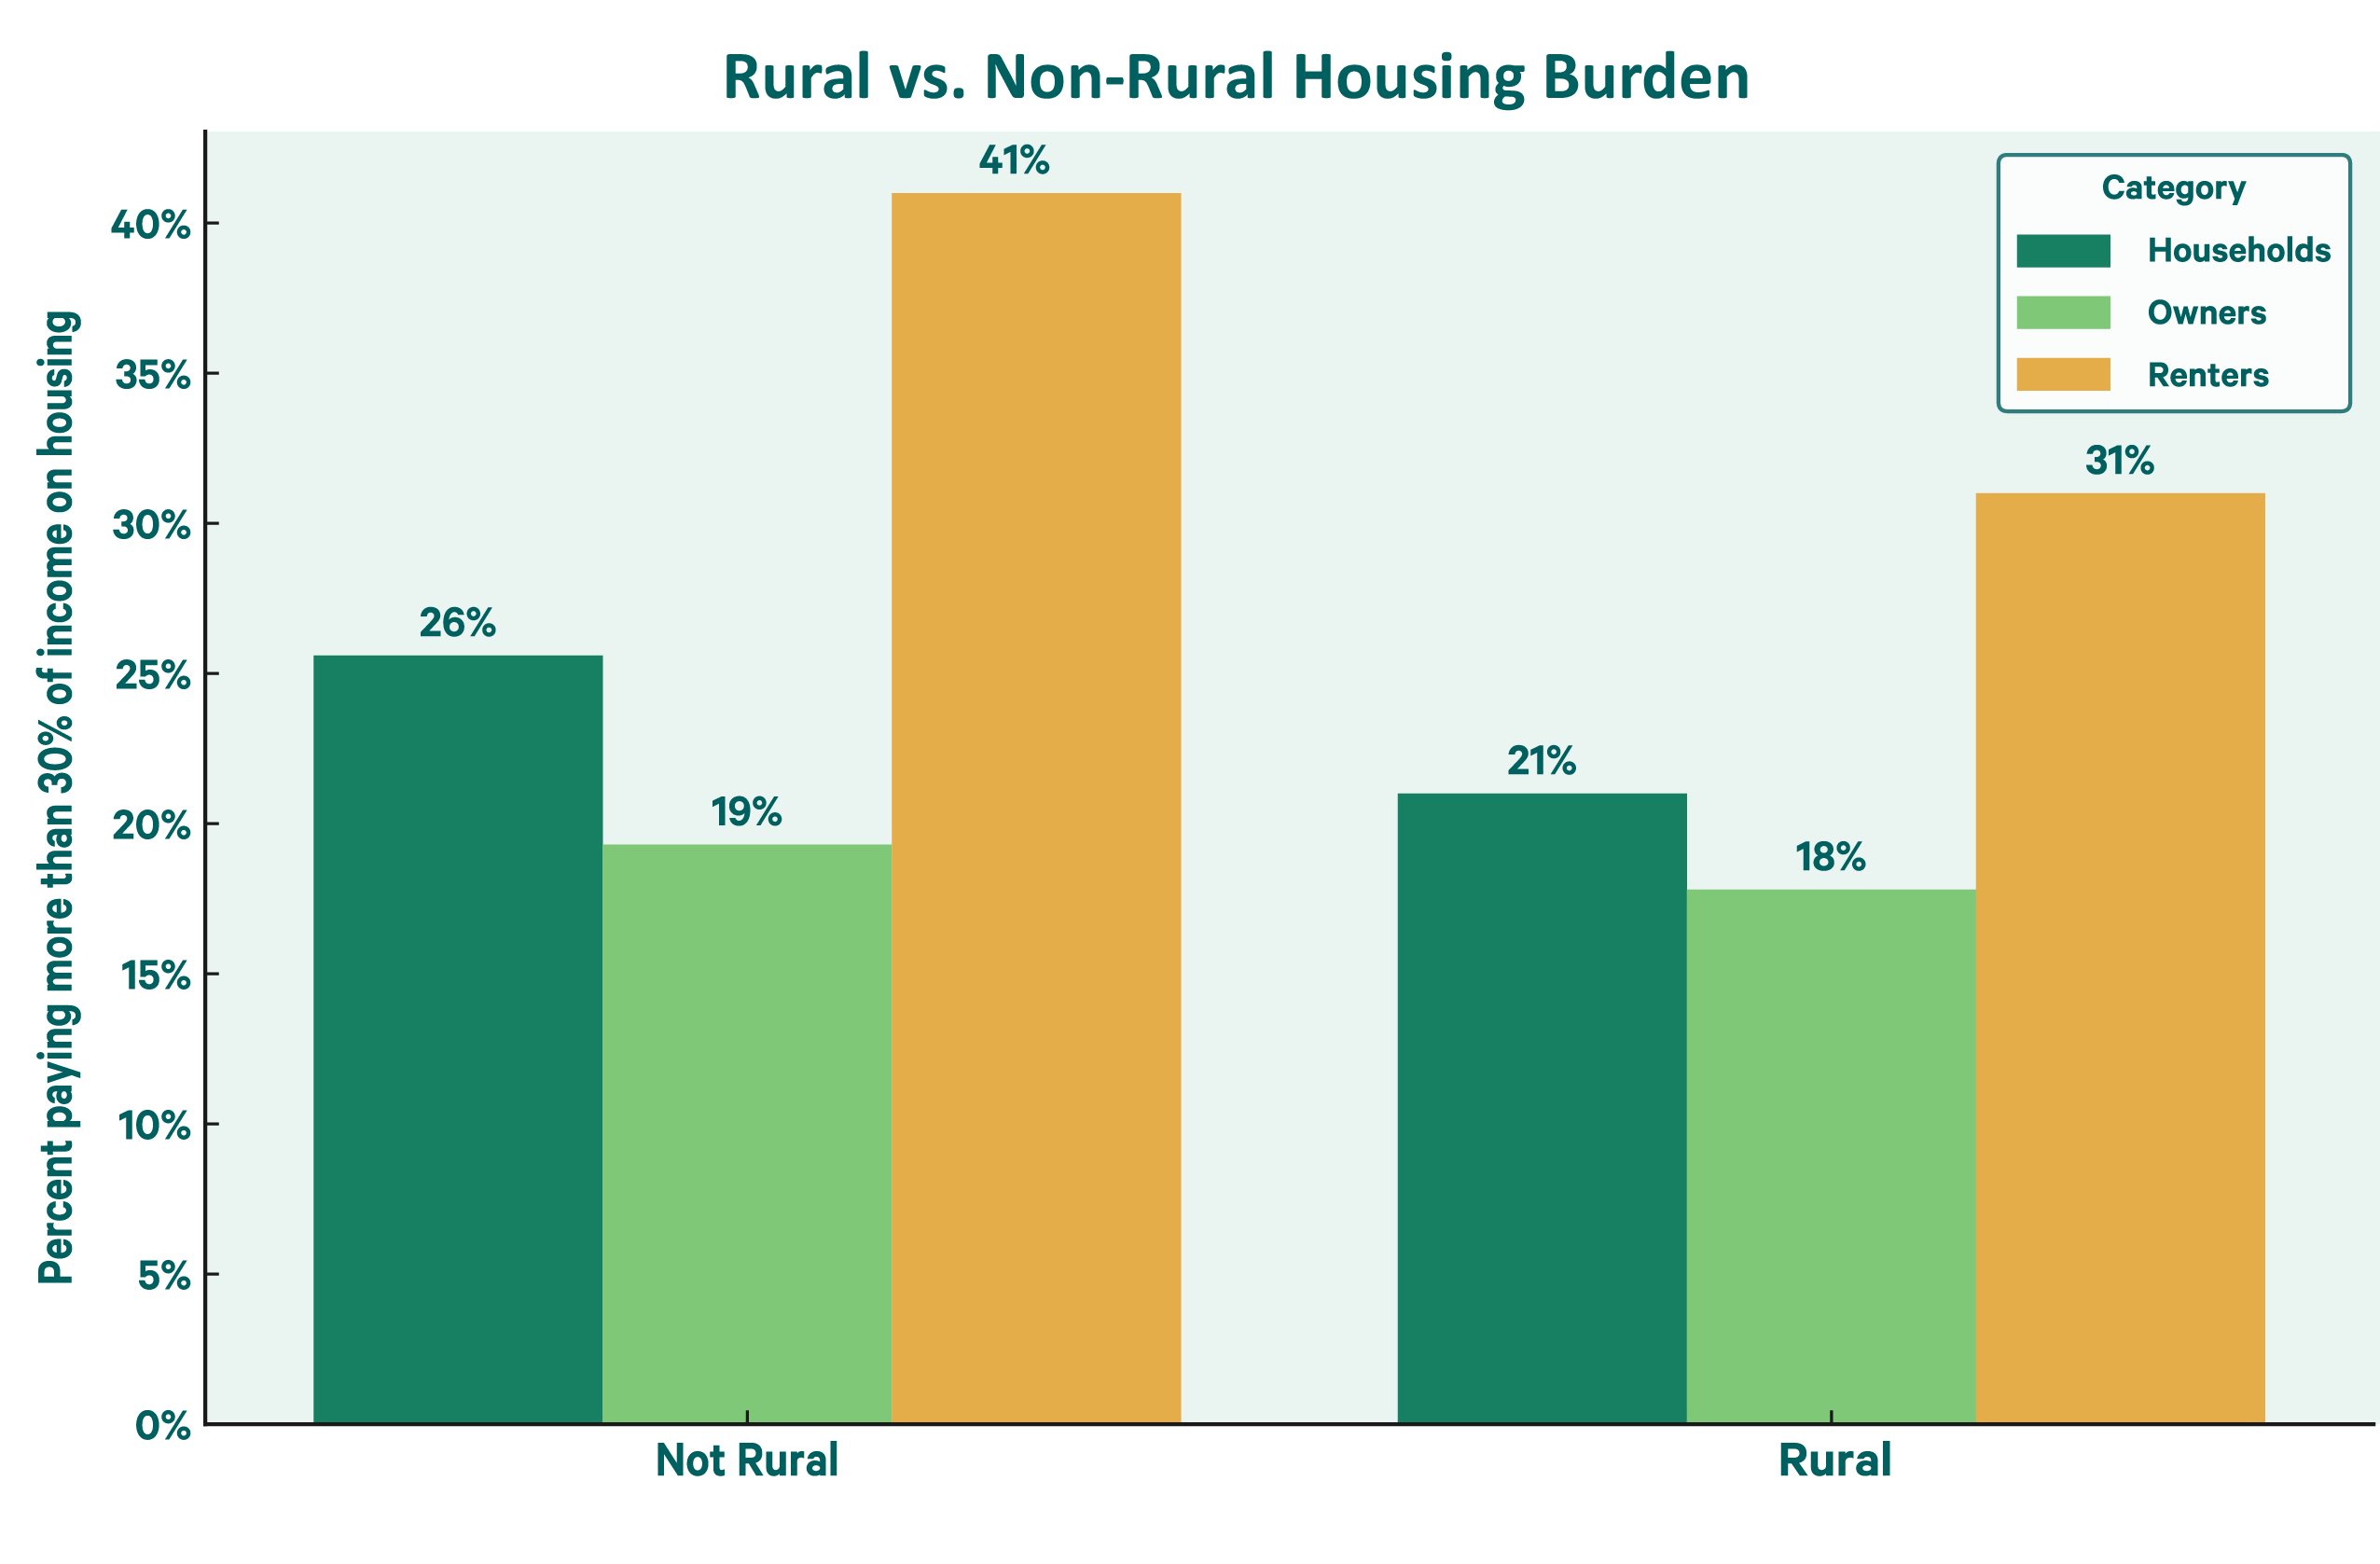
Our study also examined the number of households spending 30% or more on housing costs, which the U.S. Census Bureau defines as being housing burdened**. Overall, we found that renters are burdened at a much higher rate than homeowners, and that housing affordability increased more for homeowners in non-rural areas.
Percentage of Households Spending 30% or More on Housing
| Homeowners | Renters | |
|---|---|---|
| Rural | 17.7% | 31.1% |
| Non-Rural | 19.3% | 41.1% |
Our data shows that rural renters face a slightly higher housing burden than urban renters—just 0.1 percentage points more. The difference among homeowners is even smaller, at only 0.016 percentage points.
This translates to urban renting being about 9% less affordable than rural renting, likely due to higher rents and more competition in urban markets. In contrast, the cost of owning a home remains relatively consistent regardless of location.
We also found that switching from renting to owning significantly reduces the housing burden in both rural and non-rural areas. However, the reduction is greater for non-rural buyers (53%) than for rural buyers (43%).
In other words, while homeownership offers a major affordability advantage in urban areas, the benefit is smaller in rural communities.
These challenges raise an important question: What resources are available to help rural buyers compete?
What Affordable Mortgage Options Do Rural Buyers Have?
Despite the challenges, rural homebuyers have several tools to help increase the affordability and accessibility of homeownership.
Low Down Payment Mortgage Options
Government-sponsored entities (GSEs) and government-backed mortgages present a beacon of hope for those unable to afford a substantial down payment. Here are the top mortgage options for reducing upfront costs:
USDA Loans: Backed by the U.S. Department of Agriculture. 0% down home loan programs (USDA guaranteed and USDA direct) are available for eligible rural areas and households that make less than certain income thresholds set by the USDA.
VA Loans: Backed by the Department of Veterans Affairs. 0% down home loans for eligible Veterans, service members, surviving spouses and select others.
HomeReady® & Home Possible®: Backed by GSEs Fannie Mae and Freddie Mac, respectively. These 3% down payment conventional home loan programs are designed for buyers within a certain income threshold.
FHA Loans: Backed by HUD and the Federal Housing Administration. Typically require a 3.5% down payment and offer flexible credit guidelines.
Down Payment Assistance
Down payment assistance (DPA) programs help homebuyers cover part or all of their down payment. DPA programs are offered by various entities, including government agencies (state, county, and municipal levels), nonprofit organizations and sometimes even employers.
There are four common types of DPA programs:
Grants: The most desirable form of DPA, grants are essentially free money that does not need to be repaid. Because of their appeal, grants are typically the most difficult form of DPA to obtain.
Forgivable Loans: These loans may be forgiven after the homeowner lives in the property for a certain period, often five to 10 years.
Silent Second Mortgages: These loans create a second lien on the home but don't require payments while the homeowner lives there. They are typically due when the home is sold, the owner moves or the first mortgage is refinanced.
Second Mortgages: Some DPA programs come as fully amortizing second mortgages with monthly principal and interest payments.
Independent Mortgage Banks and Online Lending
Independent mortgage banks (IMBs) are non-depository institutions that specialize in originating and servicing home loans. Unlike traditional banks or credit unions, IMBs do not accept deposits; their primary focus is assisting individuals in obtaining mortgages.
Online lenders are mortgage companies that operate primarily or entirely online. They can be independent lenders or branches of larger institutions, but the crucial point is that they conduct all of their business digitally, from application to closing.
IMBs and online lenders help bridge gaps for borrowers in housing deserts by providing remote access to home loans, enabling buyers to complete the entire mortgage process digitally.
Are These Options Enough?
Low down payment mortgages, DPA programs, IMBs and online lenders are responsible for getting millions of people into homes. But some of these financing options can still present hurdles for rural would-be buyers.
Here are some common roadblocks to these affordable home financing options:
Strict Income Limits
USDA loans, Home Possible®, and HomeReady® Loans all have income limits. However, USDA loans are much stricter, with eligibility based on total household income, while HomeReady® and Home Possible® only consider the individual borrower’s income and may waive limits in targeted areas.
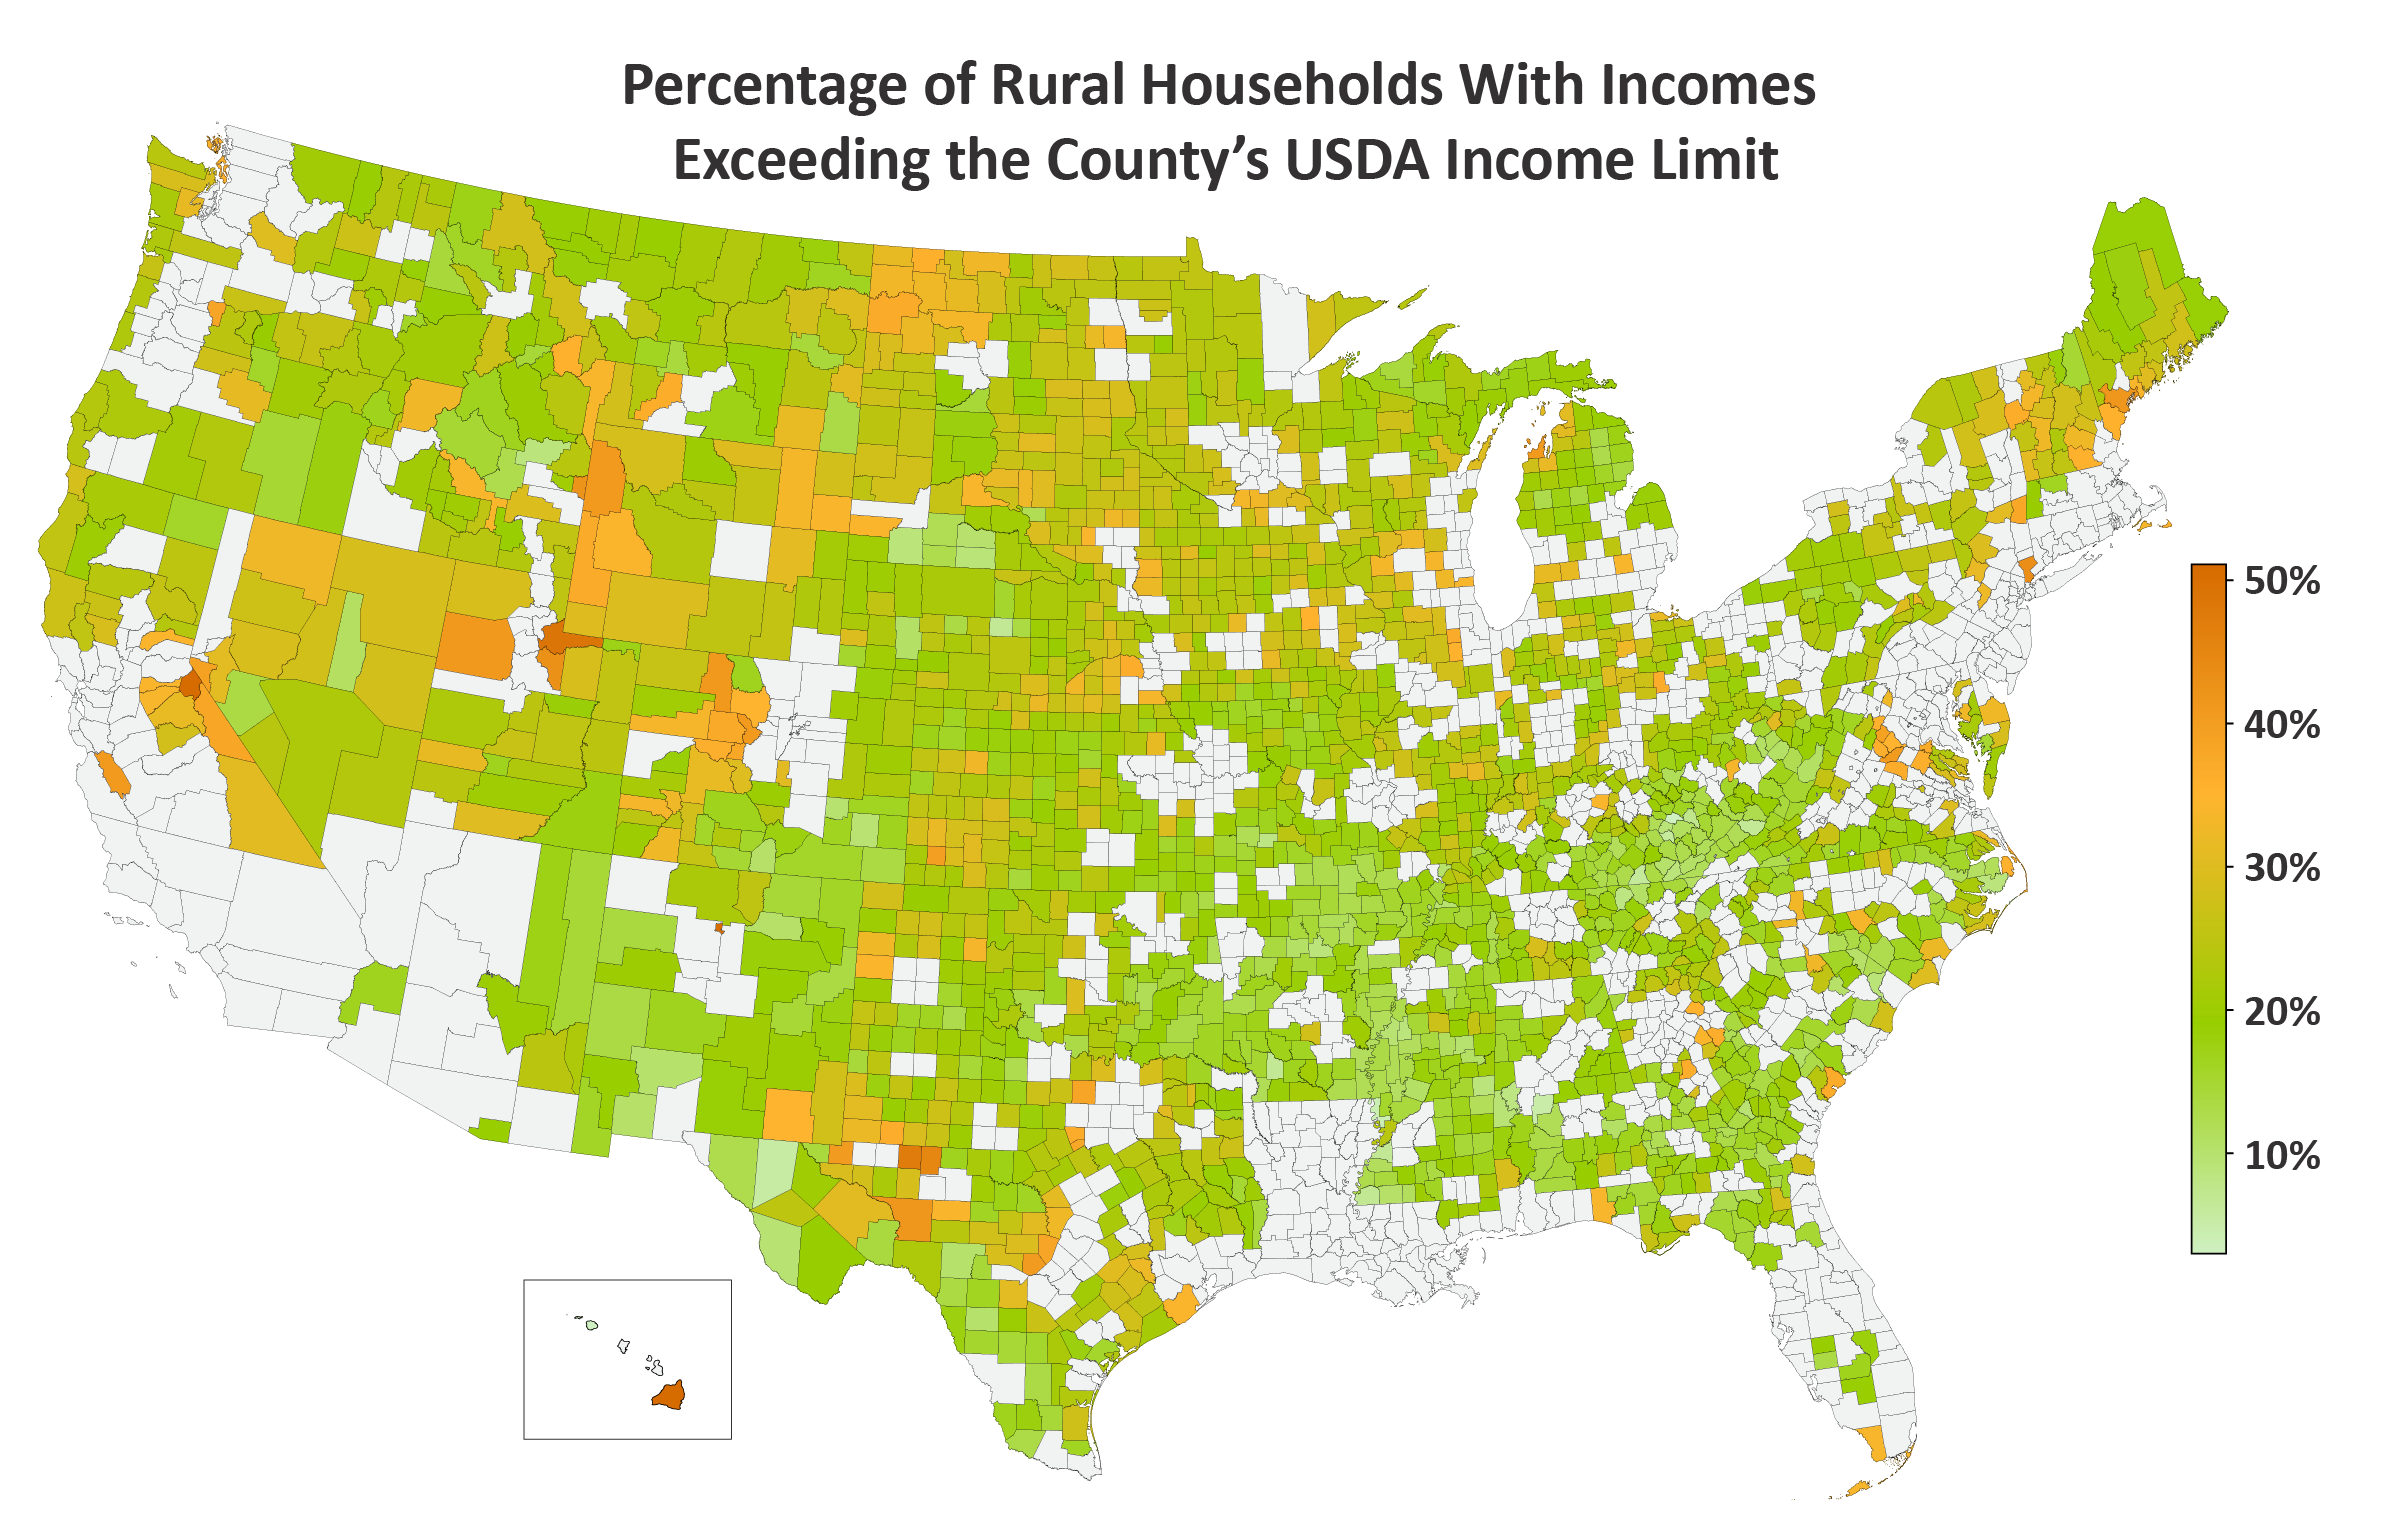
Note: Alaska, Connecticut, and Louisiana were excluded due to inconsistent county definitions across datasets.
Property Condition Restrictions
All government-backed mortgages require a home appraisal governed by minimum property requirements established by the government agency overseeing the program. While these property requirements aim to ensure safety and livability standards, they can also create obstacles to funding.
Homes in rural areas are more likely to face significant property issues due to age than those in urban areas, including heating, utility and roofing problems^. These issues all pose serious barriers to appraisal approval.
Lack of Funding for New Construction
While all government-backed mortgages technically allow for new construction financing, most lenders are reluctant to offer these options. In practice, new construction is more commonly financed with conventional loans, which tend to offer more flexibility and fewer hurdles. Government-backed loans like FHA, VA, and USDA often come with stricter appraisal guidelines, more complex builder approval processes and tighter construction timelines. These added requirements can increase the lender’s risk, making many hesitant to approve them for new builds.
Another reason conventional loans are preferred for new construction is the typical higher down payment. Borrowers using conventional financing often put down 10% to 20%, which gives lenders more confidence and reduces the risk of financial loss if construction stalls or costs overrun.
For the calendar year of 2023, government-backed loans (FHA, VA, and USDA) accounted for an estimated 18% of new construction home purchases§. The remaining 82% were financed with conventional loans or paid for in cash, underscoring the market’s strong preference for conventional financing when it comes to building new homes.
Rural Affordability is Still Ahead, But Under Pressure
To assess how rural and non-rural households are faring in terms of home affordability, we examined home price-to-income ratios, which compare the median home price to the median annual household income in that area.
A "healthy" home price-to-income ratio is generally considered to be 3.0 or less, meaning that the median home price is no more than three times the median annual household income. Housing economists and organizations such as the United Nations and the World Bank widely recognize this benchmark, which has historically served as a standard for assessing housing affordability.¶
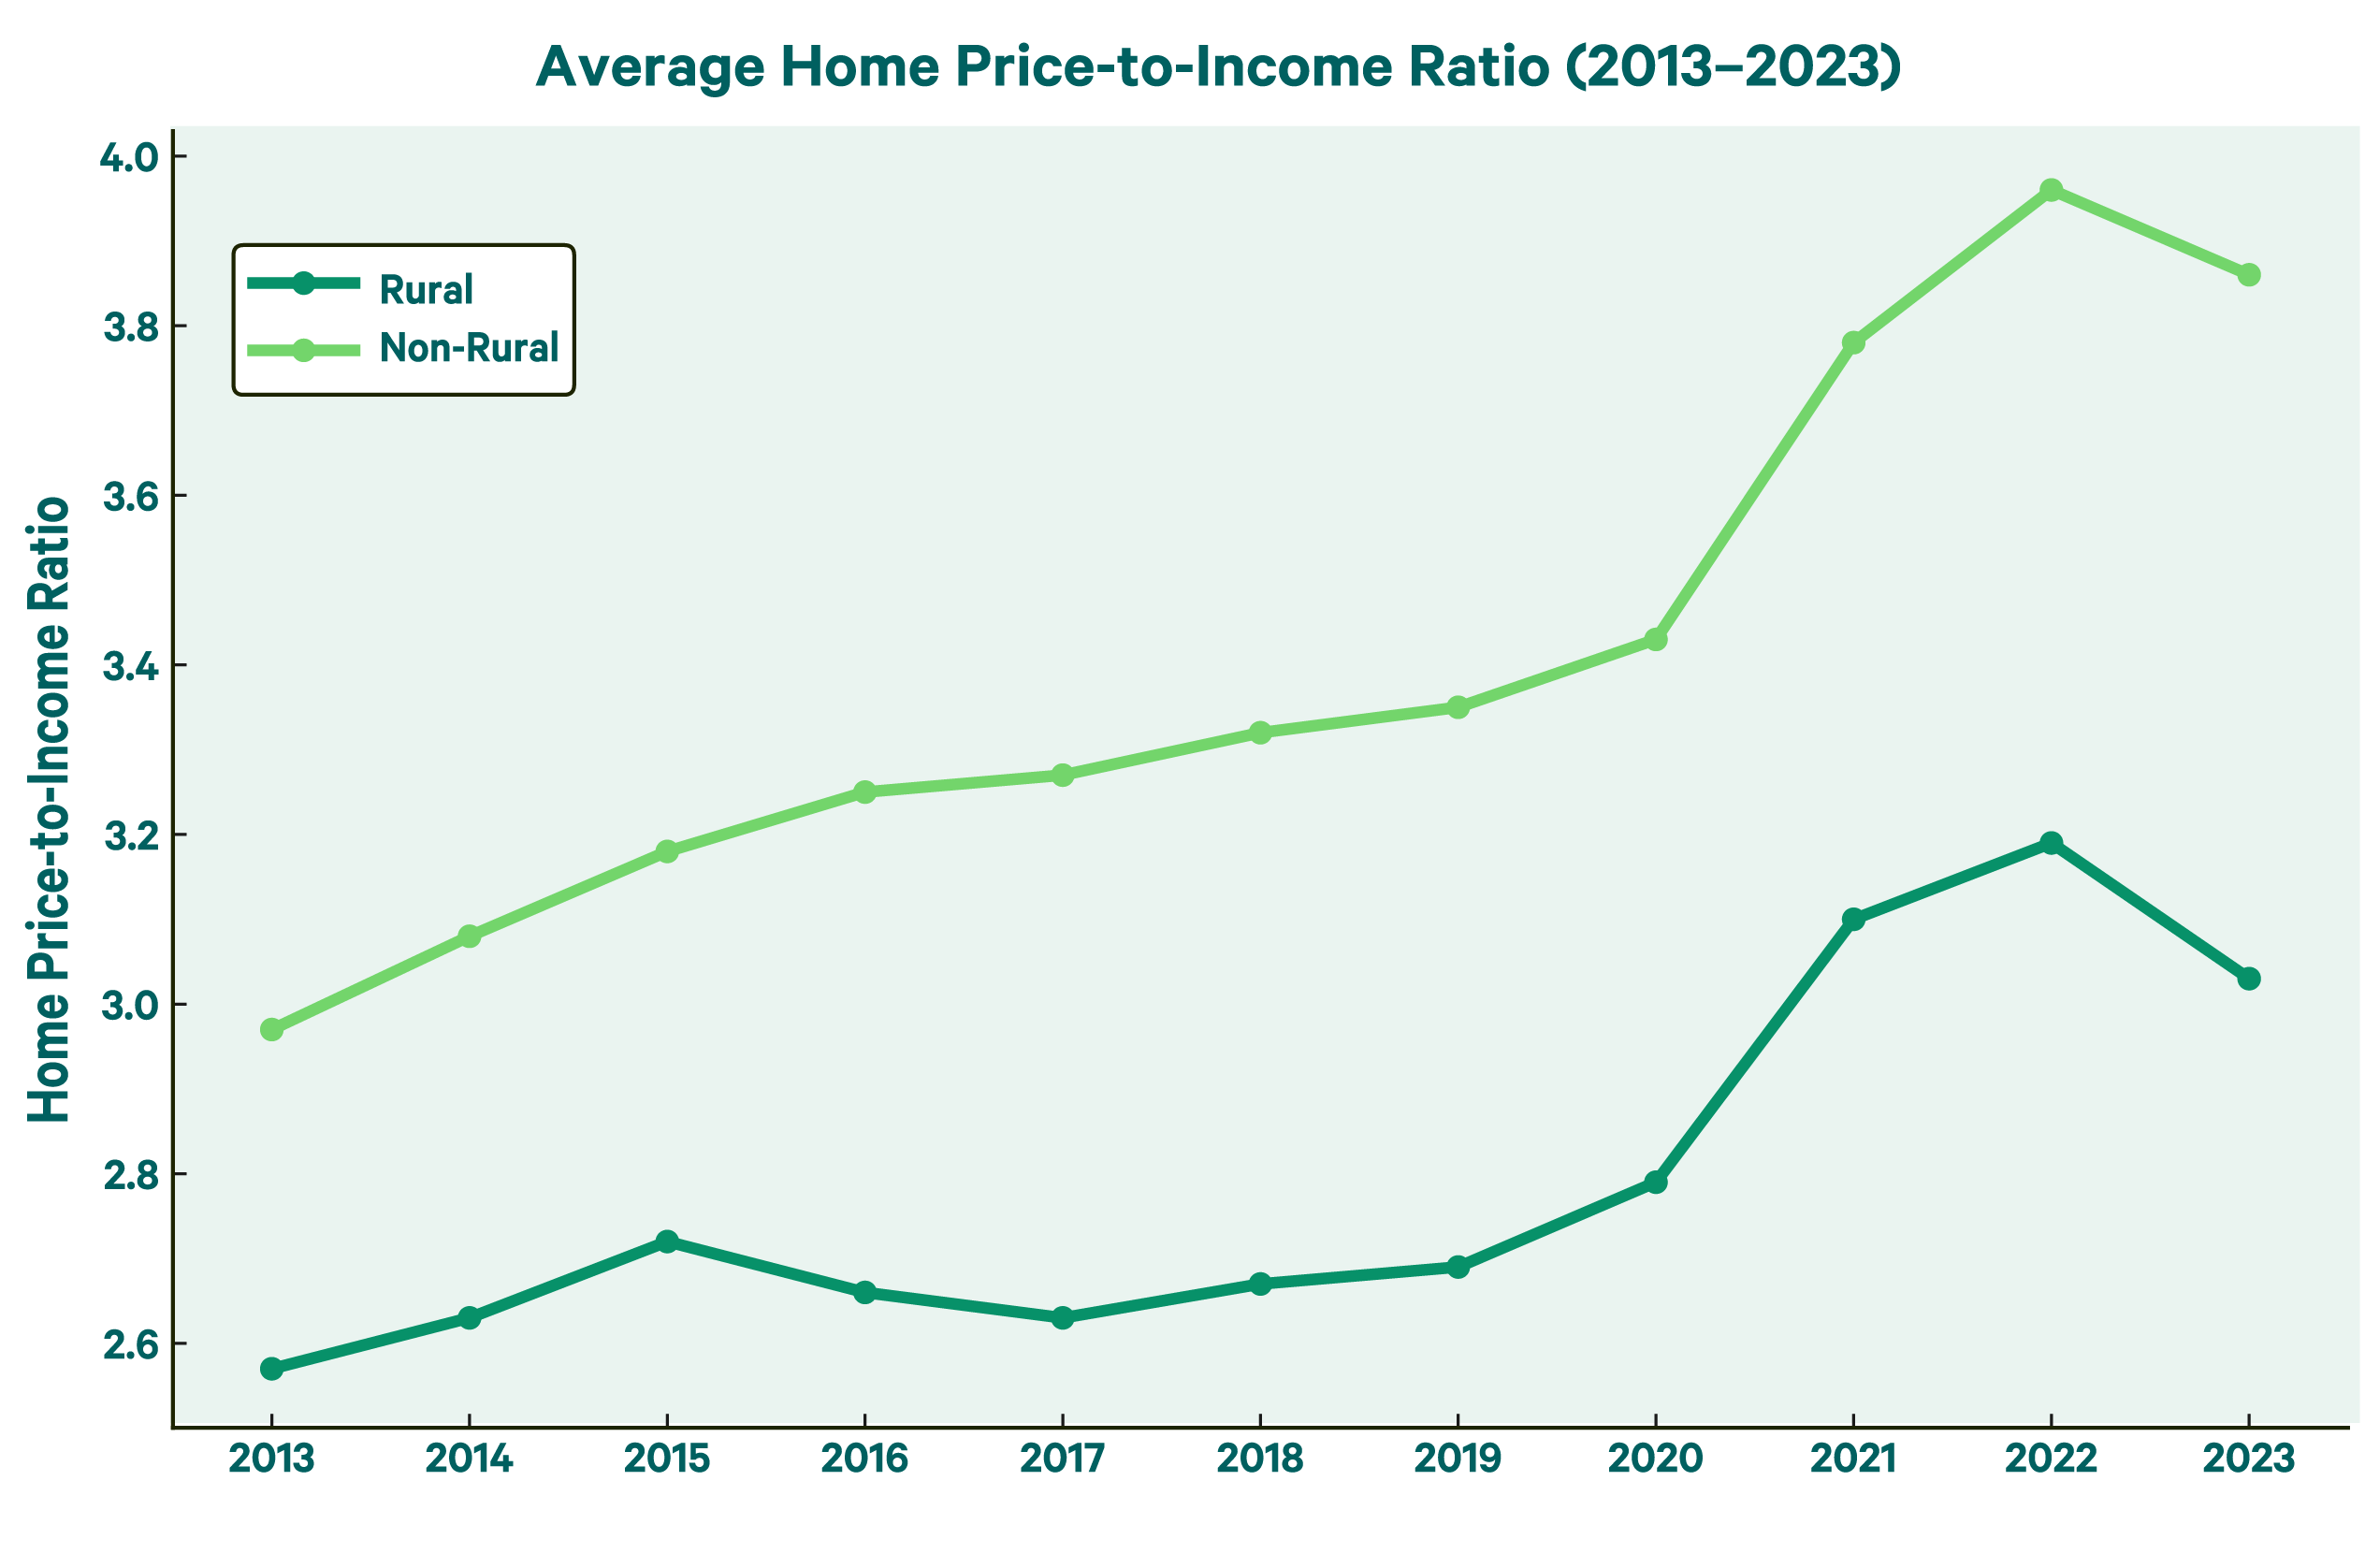
We found that rural buyers are following a very similar upward trend to non-rural buyers, but they are still quite a distance behind the unaffordability that non-rural buyers are facing.
While rural home affordability has floated above the 3.0 ratio since 2021, it has lagged behind non-rural markets, which have consistently recorded home price-to-income ratios over 3.0 since 2014, even reaching as high as 3.95 in 2022.
This relative affordability gives rural homebuyers an advantage, but it’s a fragile one.
Why This Matters
For many rural homebuyers, the path to homeownership–often viewed as a cornerstone of financial stability–is becoming increasingly elusive. This shift has far-reaching implications, not just for individuals but for entire communities. Without access to low down payment mortgages and down payment assistance programs, rural residents risk being locked out of homeownership, reinforcing generational poverty and widening the wealth gap.
As the housing market tightens across the country, this study highlights the growing economic strain on rural communities and their role in the broader national challenges of housing affordability.
For now, rural America still serves as a gateway to homeownership, offering many buyers a more attainable path to long-term financial stability in an increasingly expensive market.
Rural Buyers May Find Homeownership Most Competitive in These States
In many areas, factors like low incomes, high absorption rates, and high home prices are making housing especially competitive for rural buyers. The table below highlights several states that are especially affected by these overlapping pressures.
| State | Average Percentage of Renters Facing Housing Burden | Median Renter Income | Median Home Price | Percentage of Rural Counties With “Warm,” “Hot,” and “Very Hot” Markets | Average Poverty Rate |
|---|---|---|---|---|---|
| Colorado | 39% | $45,758 | $278,698 | 45% | 14% |
| Georgia | 34% | $29,846 | $138,410 | 62% | 22% |
| Idaho | 34% | $40,489 | $322,369 | 56% | 12% |
| Michigan | 37% | $28,550 | $153,500 | 89% | 15% |
| Minnesota | 35% | $39,250 | $190,266 | 95% | 11% |
| Nevada | 36% | $40,694 | $209,526 | 56% | 13% |
| North Carolina | 36% | $29,870 | $225,182 | 55% | 17% |
| Texas | 27% | $39,067 | $141,594 | 31% | 16% |
| Virginia | 37% | $41,172 | $237,192 | 75% | 15% |
| Wisconsin | 32% | $38,178 | $220,811 | 100% | 13% |
Note: These figures reflect averages or medians among rural counties only. Inventory analysis excluded counties with 5,000 or fewer people to minimize distortion of extremely low inventories.
Housing markets in some states are heating up rapidly. In places like Wisconsin and Minnesota where up to 100% of rural counties are classified as “warm” or hotter, homes are selling quickly and properties that do hit the market don’t stay there long. These “warm” markets typically associated with urban areas are becoming increasingly common in small towns, where low inventory meets high demand.
What makes these rural markets especially difficult is the intensity of buyer competition. Even with fewer listings, there's no shortage of interested buyers, many of whom are able to make fast, competitive offers. That puts lower-income and first-time buyers at a major disadvantage, especially those relying on slower government-backed financing or needing time to secure loan approvals.
For renters hoping to transition into homeownership, a competitive market creates a barrier to homeownership. In states like Colorado, Idaho, and Virginia, home prices in rural counties remain high, yet median renter incomes often fall below $45,000, making the leap to homeownership financially out of reach. Even in more affordable states such as Georgia and North Carolina, a significant share of renters are spending more than 30% of their income on housing—often without access to affordable mortgage options or ways to build wealth.
The gap between renters and homeowners is further widened by income disparities. In many of these states, homeowners earn nearly twice as much as renters, giving them a considerable advantage in competitive markets. Meanwhile, USDA-backed loans account for fewer than 10% of rural home purchases in several states. With government-backed financing sometimes taking a backseat to conventional loans, the path to ownership is increasingly reserved for those who can bring large down payments and make fast, competitive offers.
In addition to these issues, many rural counties are financial deserts, with few bank branches or credit unions nearby. While online mortgage options help fill the gap, lack of local financial support is still a hurdle for would-be buyers who need guidance or in-person services.
These layered challenges point to a common theme: low-income rural buyers remain locked out of homeownership, especially in competitive markets.
Methodology
Our analysis was conducted with data from the U.S. Census Bureau’s American Community Survey (ACS), Small Area Income and Poverty Estimates (SAIPE), and County Business Profiles (CBP), Redfin, Zillow, the United States Department of Agriculture (USDA), the Home Mortgage Disclosure Act (HMDA), and downpaymentresource.com.
While both the USDA and U.S. Census Bureau offer definitions of rurality based on commuting patterns, population density, and tract-level urbanization, our analysis required a uniform, county-level classification due to the structure of other available data. Because both agencies often define rural areas at sub-county levels, entire counties can include a mix of rural and urban characteristics. For consistency, we defined 'rural' counties as those with populations of 20,000 or fewer.
Counties with fewer than 5,000 residents were excluded from inventory analysis to prevent distortion due to extremely small sample sizes for home inventory. Duplicate entries, anomalous values, and suppressed Census counts were also filtered out when necessary. Alaska, Louisiana, and Connecticut were sometimes excluded from the analysis due to inconsistent county lines across data sets stemming from fluctuating county definitions and boundaries.
Housing burden was defined as households spending more than 30% of income on housing costs, in line with HUD standards. The price-to-income ratio was calculated by dividing the median home price by the median household income at the county level, and absorption rate was calculated by dividing the number of home sales by the inventory each month. Then, the average absorption rate across twelve months was collected.
Median values were used for metrics such as income and housing affordability county-wide to limit distortion to applicable variables. When measuring median values over rural status, the average of the median values for every county was collected.
Some sources only had data for years as recent as 2023. The most current data was used for each source whenever possible.
Supplemental Sources
*https://www.census.gov/library/stories/2017/08/rural-america.html
‡https://nativecdfi.net/wp-content/uploads/2024/02/Banking-Deserts-Report-Feb-2024.pdf
†https://www.ers.usda.gov/topics/rural-economy-population/rural-poverty-well-being
**https://www.census.gov/newsroom/press-releases/2024/renter-households-cost-burdened-race.html
^https://www.ruralhealthresearch.org/alerts/615
§https://www.census.gov/construction/nrs/pdf/quarterly_sales.pdf
¶https://www.ohchr.org/en/special-procedures/sr-housing/human-right-adequate-housing