So far in the 2026 filing season, the average tax refund has reached $3,521¹, one of the largest annual lump-sum payments many households will see this year.
About 72% of filers have received a refund over the past decade², making it a common benchmark for savings and a natural point of comparison for larger financial goals like buying a home.
In this study, Neighbors Bank analyzed whether the average tax refund amount can meaningfully help cover the upfront cost of buying a home, and how that number has changed over time. To do that, the study translated upfront homebuying costs into a simple metric: how many average refunds it would take to cover them.
Key takeaways
Buying a home using tax refunds takes about twice as long as it did in 2009
A 10% down purchase required just over 6 refunds in 2009 vs. more than 12 in 2025
Low down payment options reduce upfront costs, but cash to close is still required
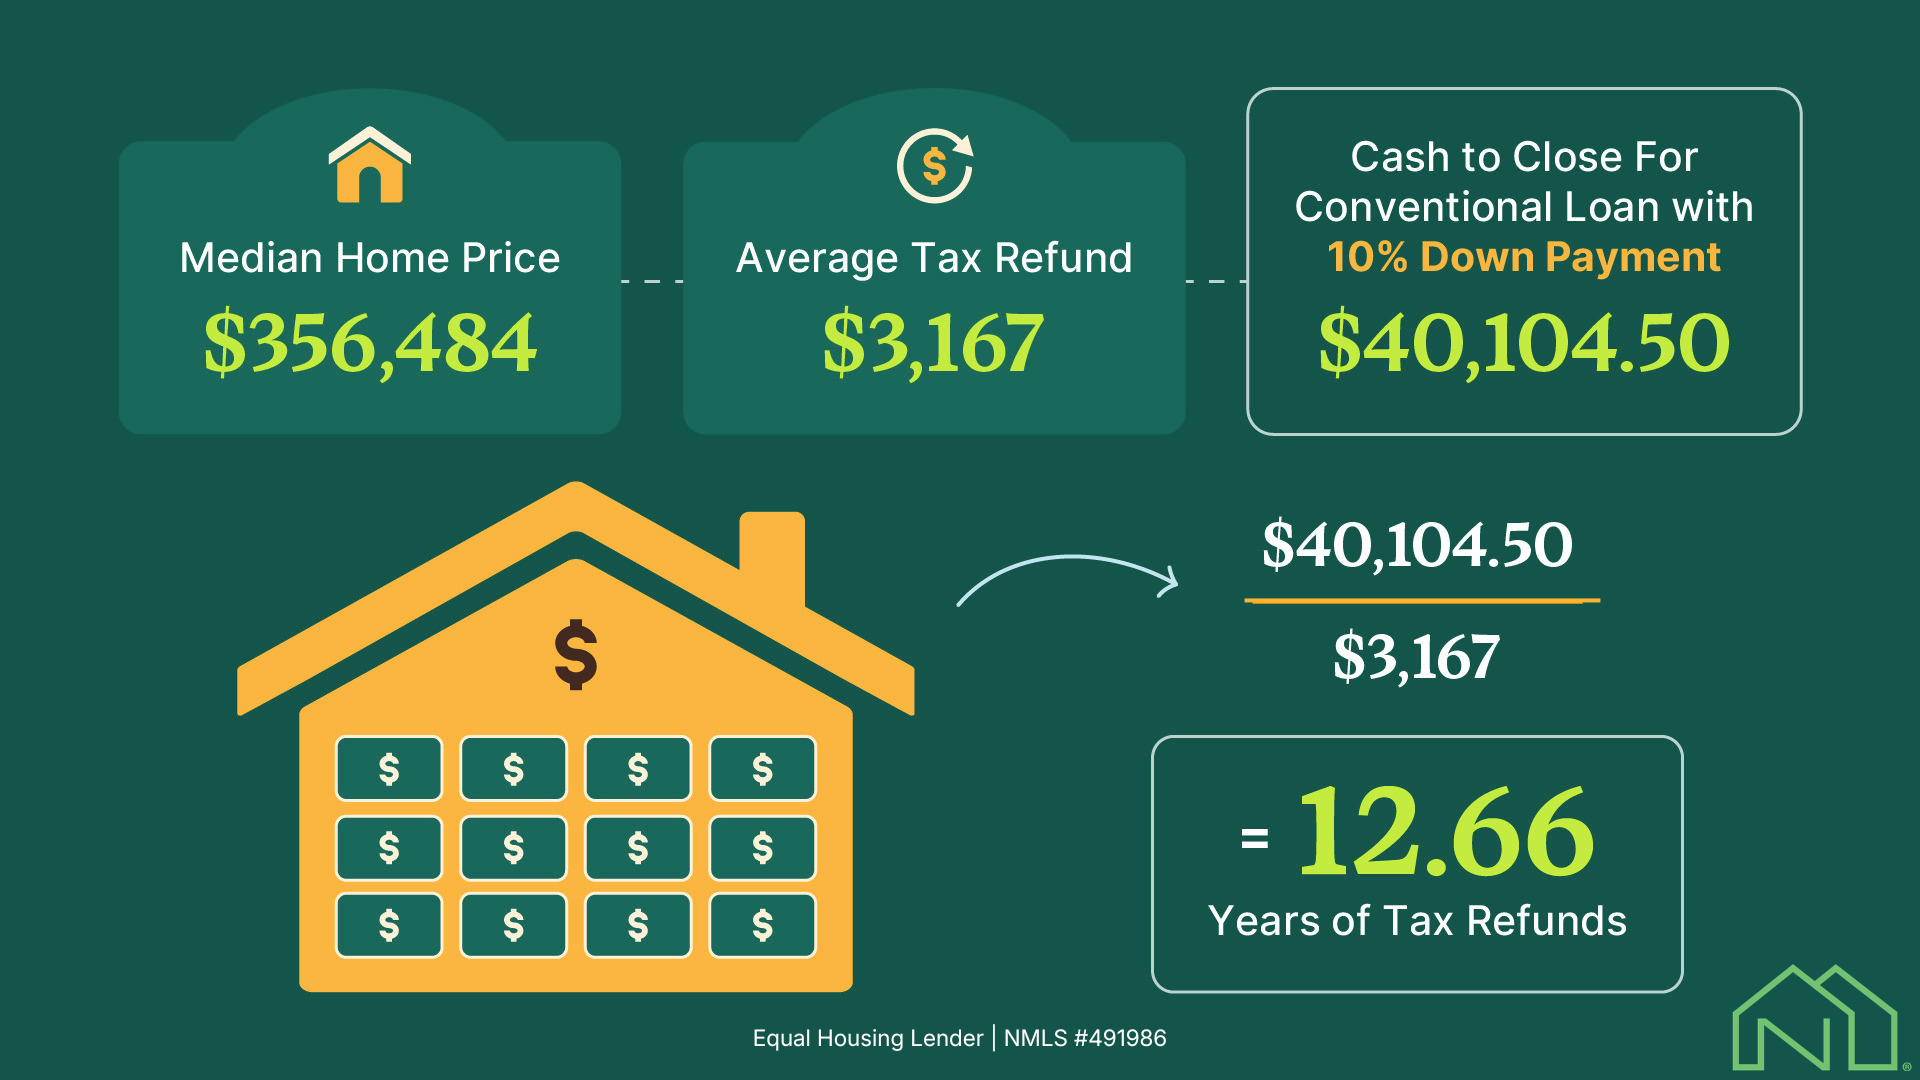
Buying a Home in 2026 Takes Over 12 Years of Tax Refunds to Afford
In 2025, the national average tax refund was $3,167, and the national median home price was $356,484. Based on those figures, the upfront cost of purchasing a median-priced home with a conventional 10% down loan equated to 12.66 average tax refunds.
In 2009, that same benchmark was 6.86 refunds, meaning the upfront cost has nearly doubled in refund terms over the period covered by this study.
This shift is largely driven by the gap between home prices and refund growth. While refund amounts have increased over time, those gains have been relatively modest and inconsistent. In contrast, the upfront cash required to buy a home has risen much more sharply, reducing how much of that cost a single refund can cover.
Tax Refunds Needed to Cover Cash to Close (10% Conventional)
| Year | Average Tax Refund Amount | Median Home Cost | Average Cash Needed For Upfront Homebuying Costs | Number of Tax Refunds |
|---|---|---|---|---|
| 2009 | $2,859 | $174,375 | $19,617.17 | 6.86 |
| 2010 | $3,003 | $168,404 | $18,945.41 | 6.31 |
| 2011 | $2,913 | $159,609 | $17,956.06 | 6.16 |
| 2012 | $2,803 | $158,262 | $17,804.48 | 6.35 |
| 2013 | $2,755 | $168,362 | $18,940.72 | 6.88 |
| 2014 | $2,792 | $179,731 | $20,219.78 | 7.24 |
| 2015 | $2,797 | $189,300 | $21,296.21 | 7.61 |
| 2016 | $2,860 | $200,861 | $22,596.85 | 7.90 |
| 2017 | $2,888 | $212,900 | $23,951.22 | 8.29 |
| 2018 | $2,899 | $226,428 | $25,473.15 | 8.79 |
| 2019 | $2,869 | $237,769 | $26,749.04 | 9.32 |
| 2020 | $2,546 | $252,564 | $28,413.41 | 11.16 |
| 2021 | $2,815 | $290,680 | $32,701.46 | 11.62 |
| 2022 | $3,252 | $333,949 | $37,569.26 | 11.55 |
| 2023 | $3,167 | $341,950 | $38,469.34 | 12.15 |
| 2024 | $3,138 | $353,334 | $39,750.08 | 12.67 |
| 2025 | $3,167 | $356,484 | $40,104.50 | 12.66 |
Note: Average tax refund is taken as the average of all filers who receive refunds, not all Americans. See more information in our methodology.
What Impacts a Tax Refund Amount?
A tax refund is not extra money from the IRS. In most cases, it reflects taxes that were overpaid during the year and then returned after a return is filed. The amount can change from one year to the next for several reasons:
Withholding and estimated payments: If more tax is withheld from paychecks, or if estimated payments are higher than necessary, the refund may be larger. If less is withheld, the refund may be smaller.
Tax credits and deductions: Eligibility for credits and deductions can reduce tax liability and change the final refund amount.
Life and income changes: Marriage, divorce, a new child, a second job, or a change in earnings can all affect how much a household receives back.
Tax law and policy changes: Updates to federal tax policy, such as changes to tax brackets, standard deductions, or credit eligibility, can directly impact how much tax is owed or refunded from year to year.
Because these factors vary over time, refund amounts do not move in a straight line. They rise and fall from year to year, which helps explain why the average refund was $3,003 in 2010 and only $2,546 in 2020.
Low Down Payment Options Help Shrink the Hurdle, But Don’t Remove It Completely
Not every buyer puts 10% down. Low- and zero-down-payment programs can reduce the amount of cash needed upfront, making homeownership more accessible for many households.
That difference is reflected in the data. In 2025, here’s how many average tax refunds it would take to buy a home across loan types:
Tax Refunds Needed to Cover Cash to Close By Loan Type
| Loan type | Average Cash to Close Needed | Average Tax Refunds Needed |
|---|---|---|
| Conventional (10% down) | $40,104.50 | 12.66 |
| FHA (3.5% down) | $23,171.49 | 7.32 |
| HomeReady / Home Possible (3% down) | $15,150.59 | 4.78 |
| VA (0% down) | $12,120.47 | 3.83 |
| USDA (0% down) | $8,020.90 | 2.53 |
Moving from a 10% down conventional loan to a 3% down option cuts the required number of refunds by more than half. Zero-down programs reduce that number even further.
However, a lower down payment does not eliminate upfront costs. Buyers still need to cover closing costs and other loan-related expenses, which means cash is still required at closing, even for 0% down payment programs like VA and USDA loans. In refund terms, that remaining upfront cost equates to 3.83 refunds for VA loans and 2.53 refunds for USDA loans in 2025.
For many households, that lower threshold may feel more achievable than saving for a 10% or 20% down payment. But it still requires planning.
A Savings Account Can Help Speed Things Up
For households able to save across multiple tax seasons, interest can help balances grow over time. One common place to keep a cash-to-close fund is a high-yield savings account (HYSA).
HYSAs typically offer higher annual percentage yields than traditional savings accounts, allowing savings to grow while funds remain accessible. These accounts are widely offered by banks and credit unions and are generally federally insured within standard limits, making them a common option for short- to medium-term savings goals like a home purchase.
For context, as of March 2026, the FDIC national average savings rate was about 0.39%3. While many high-yield savings accounts have recently advertised rates around 4% to 5% APY, these numbers can vary over time.
To illustrate, let’s see how saving for cash to close with tax refunds changes when using a HYSA at 4%:
| Scenario | Annual Tax Refund Contribution | Interest Rate | Time to Reach Cash to Close for 10% Conventional |
|---|---|---|---|
| Without HYSA | $3,167/year | 0% | 12.66 years |
| With HYSA | $3,167/year | 4% APY | 10.45 years |
| With HYSA + $50/month contribution | $3,167/year | 4% APY | 9.08 years |
Earning interest alone can shorten the timeline by more than two years. Adding even a modest monthly contribution can reduce it further.
Even so, relying on tax refunds alone can result in a longer savings horizon. Lower down payment options can significantly shorten that timeline.
| Loan Type | Refunds Needed | Scenario | Annual Contribution | Interest Rate | Estimated Timeline |
|---|---|---|---|---|---|
| Conventional (3% Down) | 4.78 | Refunds only | $3,167 | 0% | 4.8 years |
| Conventional (3% Down) | 4.78 | With HYSA | $3,167 | 4% APY | 4.1 years |
| Conventional (3% Down) | 4.78 | HYSA + $50/month | $3,167 + $600 | 4% APY | 3.6 years |
| FHA (3.5% Down) | 7.32 | Refunds only | $3,167 | 0% | 7.3 years |
| FHA (3.5% Down) | 7.32 | With HYSA | $3,167 | 4% APY | 6.2 years |
| FHA (3.5% Down) | 7.32 | HYSA + $50/month | $3,167 + $600 | 4% APY | 5.3 years |
The Path Forward
The numbers show that buying a home today requires more upfront savings than it did in the past. But they also highlight something important: there isn’t just one way to get there.
Whether it’s using tax refunds, saving month by month, or exploring lower down payment options, many buyers reach their goal by combining strategies over time. When paired with thoughtful budgeting and smart financial planning, these approaches can help shorten the path.
With the right approach, the path to homeownership can be more within reach than it first appears.
Methodology
Neighbors Bank compared the average annual tax refund with the estimated upfront cost of buying a median-priced home.
Average tax refund: Annual national average refund amounts sourced from IRS filing season statistics. Amounts averaged for all recipients of tax refunds, not all filers.
Home prices: National median existing-home prices from Zillow.
Average percentage of tax refund recipients: calculated by averaging the number of refund recipients among all filers over the past 10 years.
“Cash to close” includes:
Down payment (varies by loan type)
Loan origination fees (0.75%)
Title fees (0.5%)
Upfront mortgage insurance or funding fees (where applicable)
Specific loan scenarios include:
Conventional (10% down): Assumes no private mortgage insurance (PMI)
Conventional (20% down): Assumes no private mortgage insurance (PMI)
FHA (3.5% down): Includes 1.75% upfront mortgage insurance premium (UFMIP)
HomeReady/Home Possible (3% down): Assumes no private mortgage insurance (PMI)
VA (0% down): Includes a 2.15% funding fee (standard first-use assumption)
USDA (0% down): Includes a 1% upfront guarantee fee
General calculation: Total upfront dollars needed per loan product ÷ average tax refund dollars per year
All loan scenarios include estimated closing costs and standard lender fees unless otherwise noted.
Supplemental Sources
1 https://www.irs.gov/newsroom/filing-season-statistics-for-week-ending-march-27-2026
2 https://www.irs.gov/newsroom/filing-season-statistics-by-year
3 https://www.fdic.gov/national-rates-and-rate-caps#:~:text=About,Analysis