
The 2026 housing market has been more complex than early projections. While the National Association of Realtors' chief economist, Lawrence Yun, initially projected existing home sales would increase by 14%, home price appreciation and mortgage rates mean the NAR has updated its sales forecast and now expects existing home sales to grow by approximately 4%.
This is why buying in the right market matters more than ever right now. While the national picture has stalled, demand is building in a set of mid-sized metros that most buyers aren't looking at yet. These are places where home prices are still reasonable relative to local wages, buyer competition hasn't peaked, and economic growth is creating real momentum.
To find the best up-and-coming markets, Neighbors Bank ranked 97 mid-sized metros on six metrics covering housing demand, affordability, and economic growth. These are the 100th through 400th largest U.S. metro areas by population. Places big enough to offer good job markets and amenities, but below the threshold where competition has already priced most first-time buyers out.
If you've been waiting for rates to drop, the better move might be looking somewhere other than your current market.
The Top-Ranked Markets for First-Time Buyers
The table below ranks all 97 metros by their overall score. You'll find all six metrics side by side, including:
Home price-to-income ratio: how far your paycheck stretches in a given market. Lower is better for buyers.
Average home value: the typical price of a home in the metro. Markets with lower values leave more room for first-time buyers to get in.
Market heat index: a measure of how much buyer demand currently exceeds supply. Higher means more competition is building, which signals a market on the rise.
Employment change: job growth over the past three years. More jobs mean more people moving in and more long-term demand for housing.
Salary change: wage growth over the past three years. Rising pay means more buyers can afford to enter the market.
New establishments change: how many new businesses have opened in the metro. A growing business base is a strong signal of economic momentum.
If a city scores well across the board, it shows up near the top. Use the search bar to find a specific metro, or browse to see how markets you're considering stack up against the rest.
| Final Rank | Metro | Home Price-to-Income | Average Home Value | Market Heat Index | Employment Change | Salary Change | New Establishments Change |
|---|---|---|---|---|---|---|---|
| 1 | Charleston, WV | 2.39 | $147,264 | 69.20 | 7.4% | 16.9% | 20.4% |
| 2 | Springfield, IL | 2.31 | $185,277 | 69.60 | 7.5% | 13.6% | 3.4% |
| 3 | Racine, WI | 3.84 | $299,186 | 76.70 | 5.6% | 11.8% | 9.7% |
| 4 | Janesville, WI | 3.95 | $278,645 | 74.30 | 6.8% | 12.6% | 7.9% |
| 5 | Wausau, WI | 3.19 | $251,119 | 72.60 | 1.5% | 10.5% | 8.6% |
| 6 | Jefferson City, MO | 3.58 | $261,720 | 69.60 | 4.7% | 17.2% | 4.4% |
| 7 | Binghamton, NY | 2.85 | $186,887 | 67.90 | 5.6% | 12.6% | 3.1% |
| 8 | Lansing, MI | 3.35 | $241,006 | 71.10 | 8.8% | 11.6% | 3.4% |
| 9 | Manhattan, KS | 3.68 | $258,965 | 57.90 | 41.8% | 15.8% | 43.3% |
| 10 | Sheboygan, WI | 4.27 | $307,130 | 72.50 | 4.4% | 14.2% | 6.8% |
Source: Neighbors Bank study using Zillow, U.S. Census Bureau, and BLS data
Charleston, WV, Springfield, IL, and Racine, WI top the overall rankings, followed by Janesville, WI, and Wausau, WI. If you notice a pattern, you're right. Many of the high-ranking areas in this study are mid-size Midwest metros, where demand is rising, but home prices and price-to-income ratios haven't caught up yet.
First-place Charleston is a good example of what that looks like in practice. A typical home value of $147,264 and a price-to-income ratio of 2.4x means buyers can get into the market at less than half the national average home value ($370,320). With a market heat index of 69.2, housing demand in Charleston is building.
Reading the Market: Heat, Home Prices, and What Local Wages Can Support
The overall score tells you where a market lands, but the individual metrics tell you why. Here's a closer look at how the 97 metros break down across each category, so you can find the markets that matter most for your situation.
Which markets have the most buyer demand?
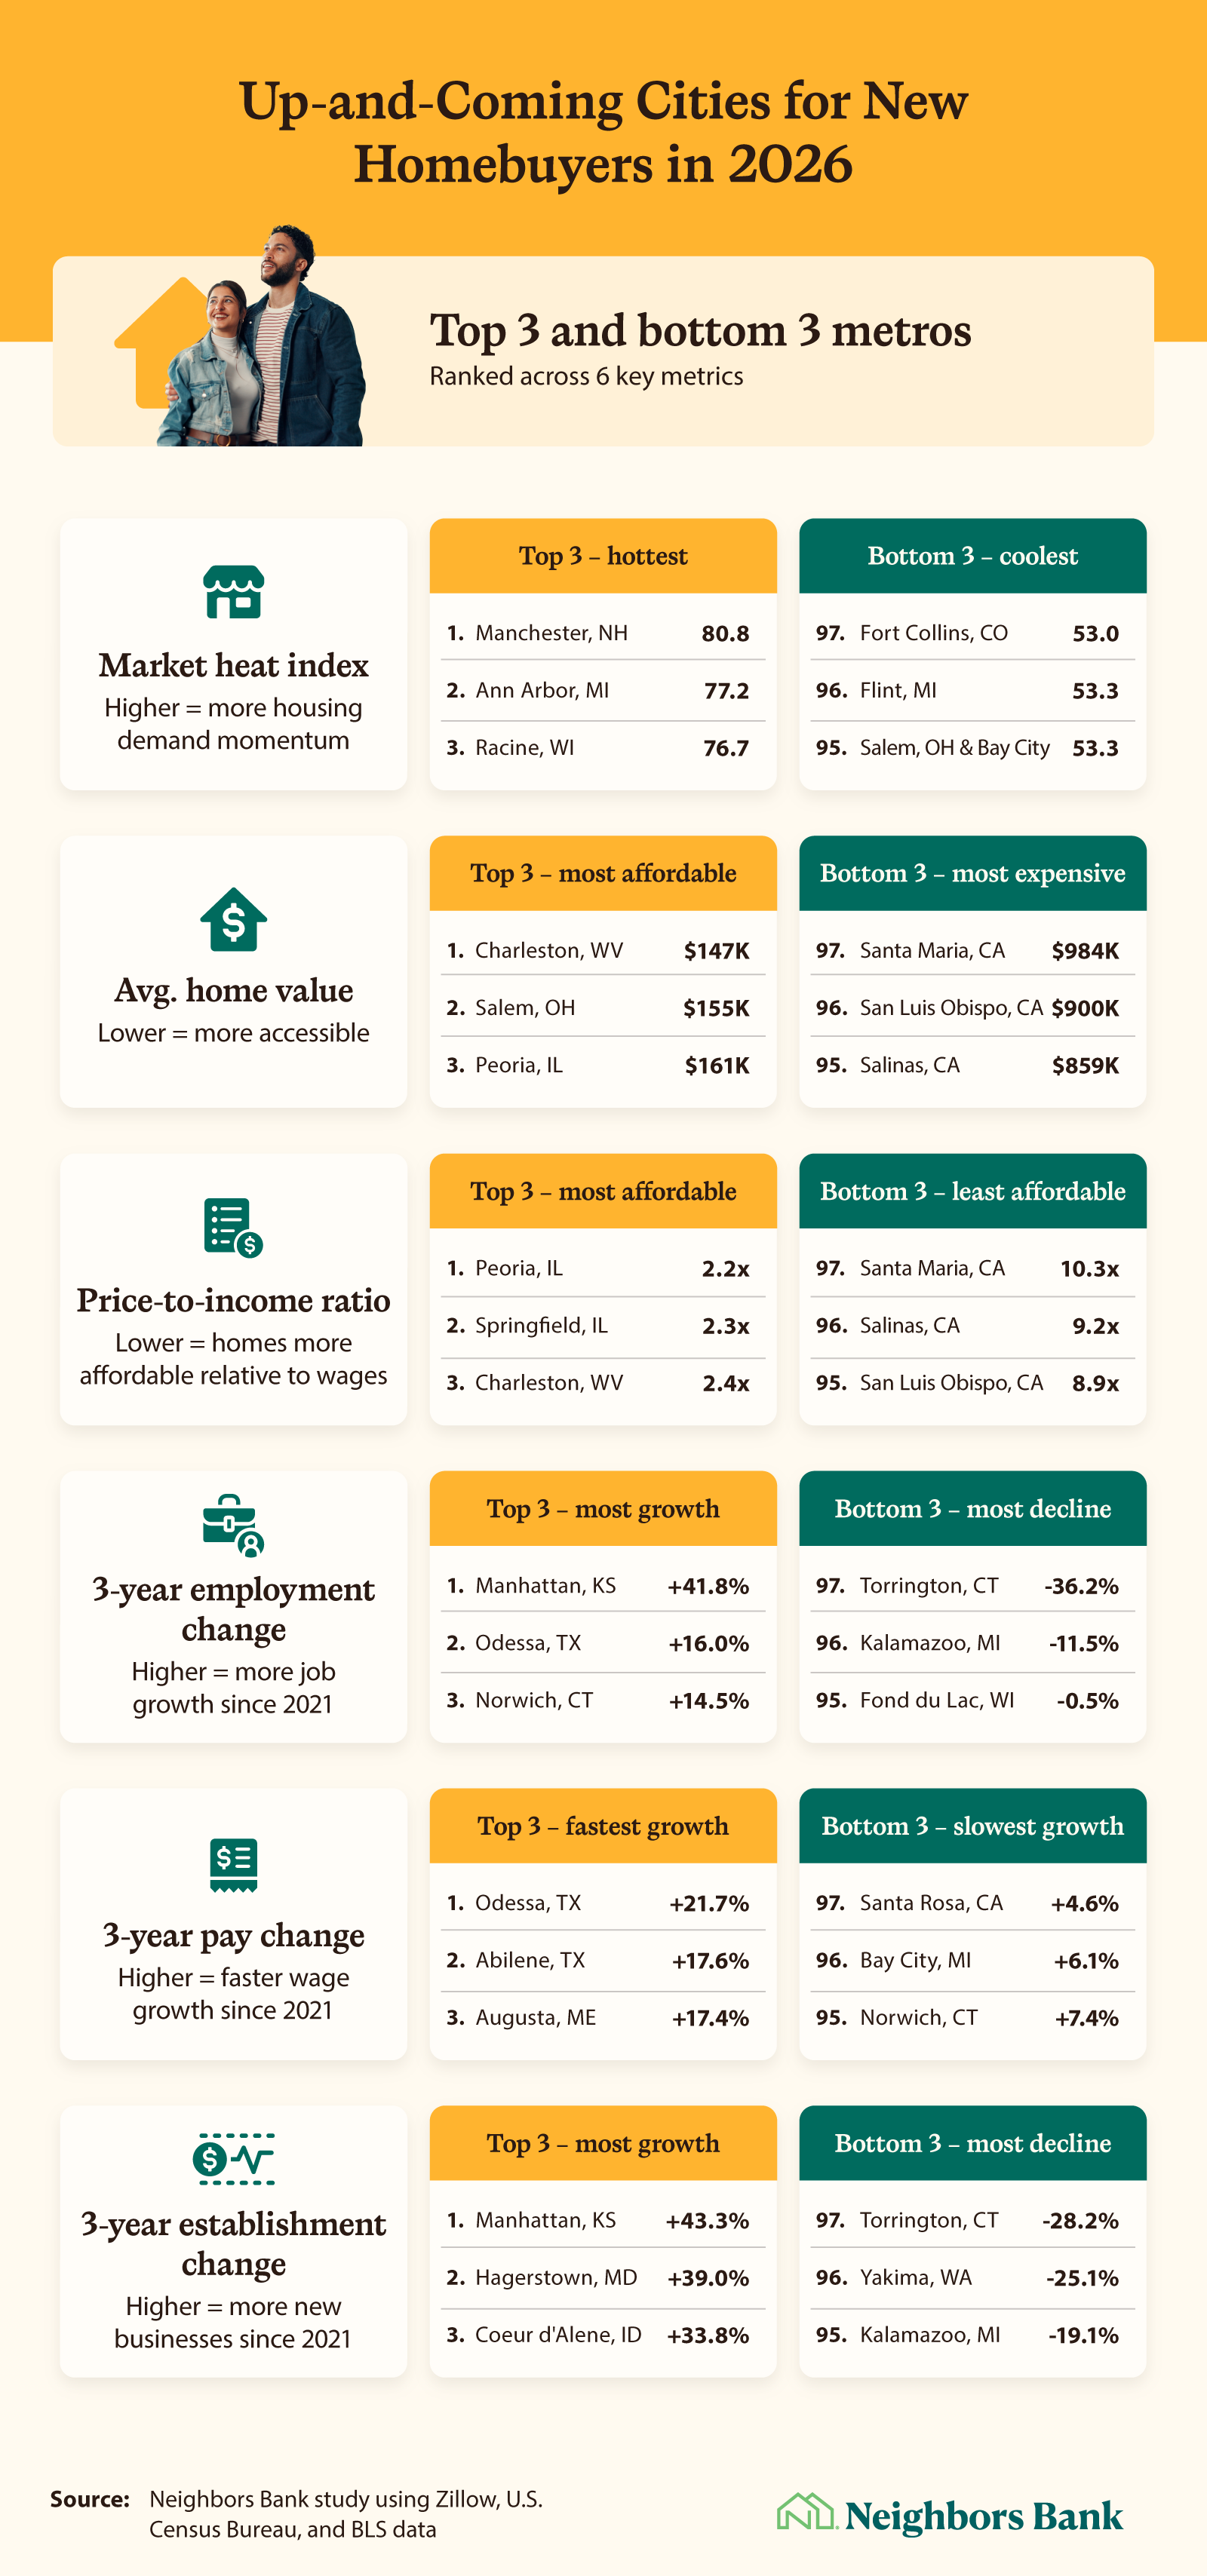
The hottest market heat indexes in the study belong to Manchester, NH (80.8), Ann Arbor, MI (77.2), and Racine, WI (76.7). But a sky-high heat index isn't necessarily what first-time buyers should be chasing.
The more interesting opportunity is in markets that sit just above the national average of 53, where buyer demand is outpacing supply but competition hasn't become prohibitive yet. Fort Collins, CO (53.0), Flint, MI (53.3), and Salem, OH/Bay City, MI (both 53.3) sit at that threshold.
Where are homes most affordable?
By average home price, the most accessible markets in the study are Charleston, WV ($147,264), Salem, OH ($155,405), and Peoria, IL ($161,124). "Affordable markets still exist," says Ashley Harris, Director of Homebuyer Education at Neighbors Bank. "Peoria and Charleston are proof that affordable homes have not disappeared from major metro areas."
Salem has an additional advantage for eligible buyers: USDA loan eligibility. With a 0% down payment available on qualifying loans, a $155K price point can be a genuine opportunity. "For eligible buyers, assistance programs may help cover part or even all of the down payment and closing costs," Harris adds. "Price, program, and strategy all matter."
At the other end, three California metros sit well out of reach for most first-time buyers: Santa Maria ($984,462), San Luis Obispo ($900,277), and Salinas ($858,700).
Where do local wages go furthest?
A $300K home hits differently depending on where you live and what you earn. Peoria, IL (2.2x), Springfield, IL (2.3x), and Charleston, WV (2.4x) have the lowest price-to-income ratios in the study, meaning home prices are most affordable relative to what residents earn. Santa Maria (10.3x), Salinas (9.2x), and San Luis Obispo (8.94x) have the highest. A typical home in those markets costs more than 8 to 10 times what the average resident earns in a year.
Where is the economy growing?
The metros with the strongest three-year employment growth since 2021 are Manhattan, KS (+41.8%), Odessa, TX (+16.0%), and Norwich, CT (+14.5%), and each runs on a different engine. Odessa's gains come from oil and gas, the region's dominant cluster, which makes up more than a quarter of local jobs and expanded 51% between 2016 and 2023. Norwich's growth comes from defense shipbuilding, led by General Dynamics Electric Boat, which has been hiring several thousand workers a year across its yards and supplier base to meet Navy submarine demand. Wage growth was fastest in Odessa, TX (+21.7%). As for new business formation, Manhattan, KS (+43.3%), Hagerstown, MD (+39.0%), and Coeur d'Alene, ID (+33.8%) led the way, adding the most establishments. These are markets where jobs, paychecks, and businesses are all moving in the right direction.
Finding Your Market Before Everyone Else Does
Neighbors Bank already tracks the best cities for first-time homebuyers every year. But this study exists because 2026 called for a closer look. The summer rebound that buyers and sellers were counting on hasn't arrived, and waiting for the national market to shift in your favor is its own kind of risk.
The good news is that the opportunity to own a home hasn't disappeared. The right location, loan, price point, and timing can still add up to a realistic path to ownership.
If the cities you've been watching feel out of reach, it may be time to look at what's happening a little further off the beaten path. Neighbors Bank can help you figure out whether you're ready to make a move, and where that move might make the most sense.
Methodology
To identify up-and-coming markets, we started with Zillow metros ranked 100–400 by size. "Mid-sized cities" are defined as metro areas ranked 100th to 400th by population, using Zillow's SizeRank field (where rank 1 is the most populous metro). Mid-sized cities are large enough to offer real job markets and amenities, but small enough that competition hasn't yet peaked.
We then filtered to metros with an average 2025/2026 Market Heat Index (MHI) between 53 and 80. The U.S. average MHI was 53, so this ensured every market in our universe was running above the national baseline on demand, but below the threshold where competition becomes prohibitive for first-time buyers.
Each qualifying metro was then scored on six metrics and ranked on a composite index.
Market Heat Index (Zillow, 2025/2026 average): weighted at 25%, serving as a secondary signal since MHI had already been used as a selection filter.
Price-to-income ratio: weighted at 25%. Calculated by dividing each metro's average home value by its median household income, sourced from the U.S. Census Bureau's American Community Survey 1-year estimates (2024).
Average home value (Zillow ZHVI, 2025/2026 average): weighted at 20%.
3-year employment growth (BLS QCEW, 2021 to 2024): weighted at 10%. Calculated as the percent change in average annual employment level between 2021 and 2024.
3-year pay growth (BLS QCEW, 2021 to 2024): weighted at 10%. Calculated as the percent change in average annual pay between 2021 and 2024.
3-year establishment growth (BLS QCEW, 2021 to 2024): weighted at 10%. Calculated as the percent change in average annual establishment count between 2021 and 2024.
All metrics were normalized to a 0–100 scale before scoring, with affordability metrics inverted so that lower home values and lower price-to-income ratios produce higher scores. Metros were ranked from 1 to 97 by composite score, with rank 1 representing the strongest combination of demand momentum, first-time buyer accessibility, and economic vitality among the metros included in the study. Rankings reflect metros included in the study only and are not representative of all U.S. metros.
Limitations:
Size rank exclusions. Limiting the metro universe to size ranks 100–400 excludes both the largest U.S. metros (which are generally unaffordable for first-timers) and the smallest (where data reliability thins). Some legitimate emerging markets outside this range are not represented in the rankings.
Metro-level data masks neighborhood variation. All metrics are reported at the MSA level. Within any ranked city, affordability and demand conditions can vary significantly by neighborhood or zip code.
No mortgage rate personalization. The price-to-income ratio used in this study reflects gross income relative to home price and does not account for prevailing mortgage rates, down payment size, credit profile, or total monthly housing costs. Actual affordability for individual buyers will vary.
About Neighbors Bank
Neighbors Bank is a home loan lender dedicated to helping everyday Americans on the path to homeownership. Specializing in mortgage products designed for first-time homebuyers, Neighbors Bank combines competitive rates with a clear process so you can focus on finding the right home and not get lost in the paperwork.
Fair Use Statement
The data and findings in this study are available for free use under fair use guidelines. When referencing or republishing this research, please attribute the work to Neighbors Bank and link to the original article.