The cost of putting down roots can look very different from one community to the next. In some markets, a starter home comes with a lower estimated monthly housing payment than a comparable rental. In others, renting leaves more room in the monthly budget. Understanding that local picture is a useful starting point for weighing the options.
To help prospective homebuyers make that comparison, Neighbors Bank analyzed buying and renting costs across the 50 largest U.S. metro areas and surveyed 1,166 recent first-time homebuyers about why they bought and the financial trade-offs involved, including changes to their spending and savings.
Under the study’s assumptions, buying a starter home was estimated to have lower monthly costs in 23 of the 50 metros. Those estimates offer a starting point for a broader conversation: how each option fits a household’s budget, priorities, and plans for the future.
How we compared costs: The cost of buying is the full monthly housing payment, not just the mortgage. That includes principal, interest, property taxes and homeowners insurance (PITI), plus private mortgage insurance. The cost of renting is the asking rent for a comparable home. A “starter home” is an entry-level single-family house in the lowest third of home values in each metro, the kind of home first-time homebuyers most often compete for.
Key Takeaways
Buying a starter home is cheaper than renting in 23 of the 50 biggest U.S. cities.
The best markets for buying are Birmingham, Pittsburgh, and Memphis, where owning a starter home runs about $625, $609, and $597 less per month than renting.
The best markets for renting are San Jose, San Diego, and San Francisco, where renting runs about $3,814, $1,738, and $1,534 less per month than owning.
Nearly half of first-time homebuyers (49%) bought where renting was cheaper month-to-month, choosing to build equity over a lower monthly bill.
Building equity is the top reason first-time homebuyers bought, named by 2 in 5, while rising rent was the main reason for fewer than 1 in 10.
Nearly half of first-time homebuyers (47%) cut savings to make homeownership possible, reducing retirement contributions or other savings to afford the purchase.
About 1 in 3 first-time homebuyers (33%) took on credit card debt or other debt after buying to cover expenses they could previously afford while renting.
Note: See rate and other assumptions behind these figures are detailed in the methodology below. These cost comparisons come from a hypothetical model, not the actual outcomes of the homebuyers surveyed.
How Monthly Buying and Renting Costs Compare
Neighbors Bank compared the estimated monthly cost of owning a starter home with the asking rent for a comparable single-family home across the 50 largest U.S. metro areas, using July 2026 data. Each metro includes the city and its surrounding suburbs.
The ownership estimate assumed a 5% down payment and a 30-year fixed-rate mortgage. It included mortgage principal and interest, property taxes, homeowners insurance, and private mortgage insurance. The comparison focused on these monthly costs, excluding maintenance, utilities, homeowners association fees, closing costs, and the equity a homebuyer could build.
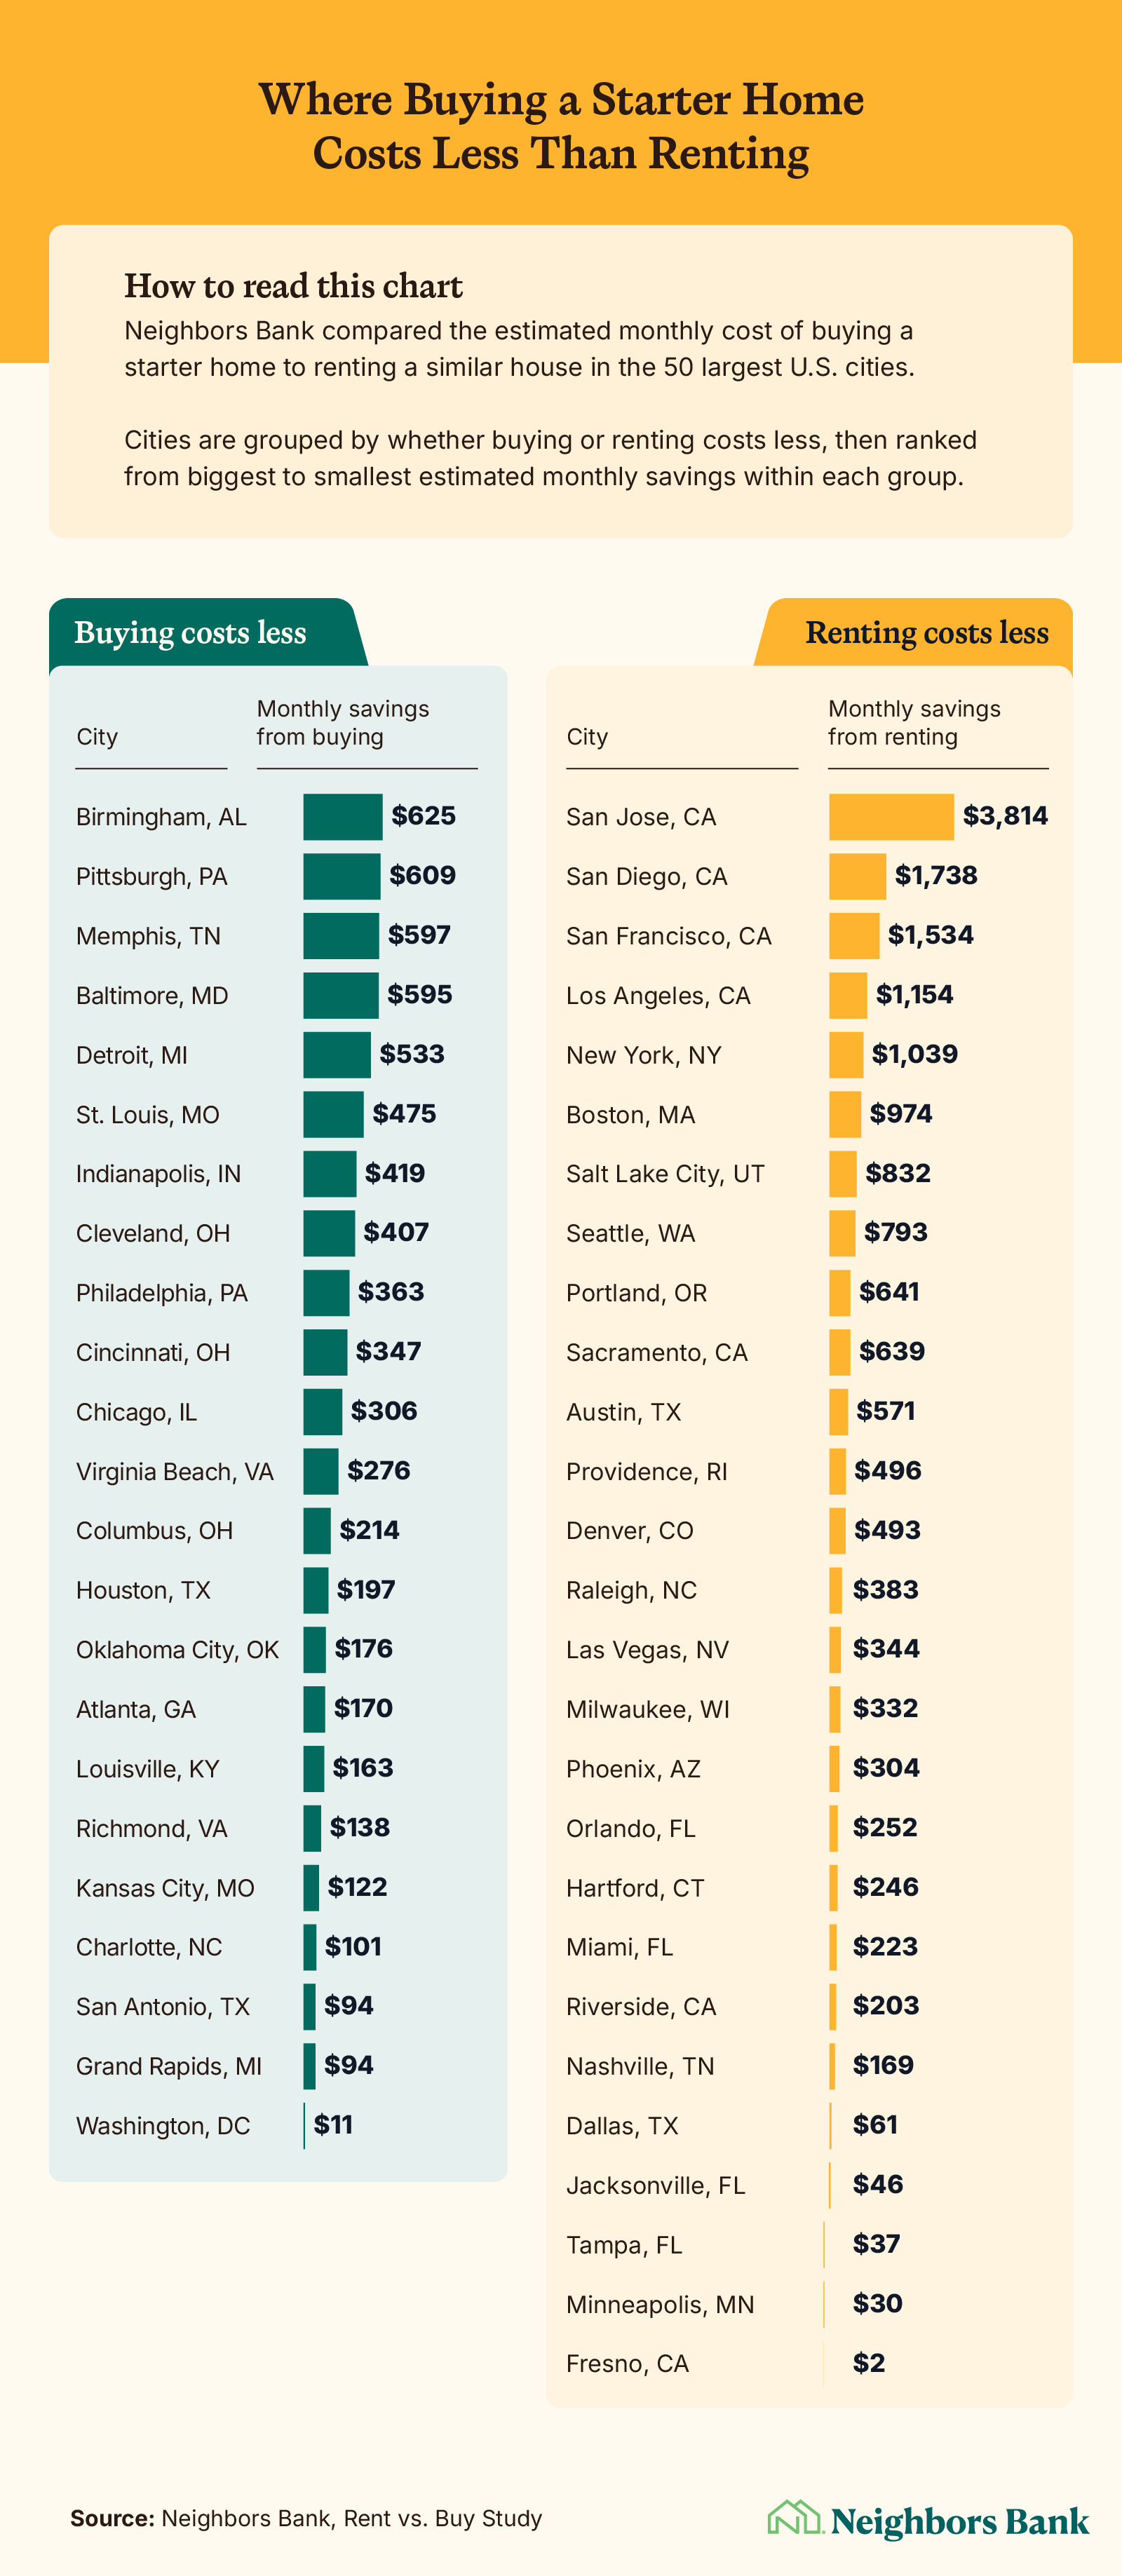
Across the 50 largest U.S. metro areas, buying a starter home costs less each month than renting a comparable house in 23 cities, or 46%. The biggest savings were in the affordable Midwest and South, where owning was about $625 a month less than renting in Birmingham, $609 less in Pittsburgh, and $597 less in Memphis.
Four cities, Birmingham, Memphis, Detroit and Pittsburgh, clear an even tougher test: buying a starter home there costs less than what current renters already pay, not just less than the higher rents landlords are now asking. Since existing renters usually pay less than someone signing a new lease, that is the hardest result in the study to achieve.
California told a different story. Renting a starter home costs far less than owning in San Jose, where the gap was about $3,814 a month. San Diego ($1,738), San Francisco ($1,534), and Los Angeles ($1,154) followed, with Sacramento coming in at $639 less per month when renting.
Multiple Florida cities also landed on the "renting costs less" side, including Orlando, Miami, Jacksonville, and Tampa. Their estimated monthly savings, though, were smaller: $252, $223, $46, and $37, respectively.
For prospective homebuyers, comparing specific neighborhoods, nearby communities, and available home loan options can help estimate monthly costs. Factoring in upfront expenses, ongoing maintenance, and how long they plan to stay can help clarify whether buying or renting is a better fit for their budget and goals.
Why First-Time Homebuyers Chose to Buy Instead of Rent
Monthly costs were one part of the decision for recent first-time homebuyers. Their responses show how building equity and expectations about mortgage rates also factored into why and when they bought.
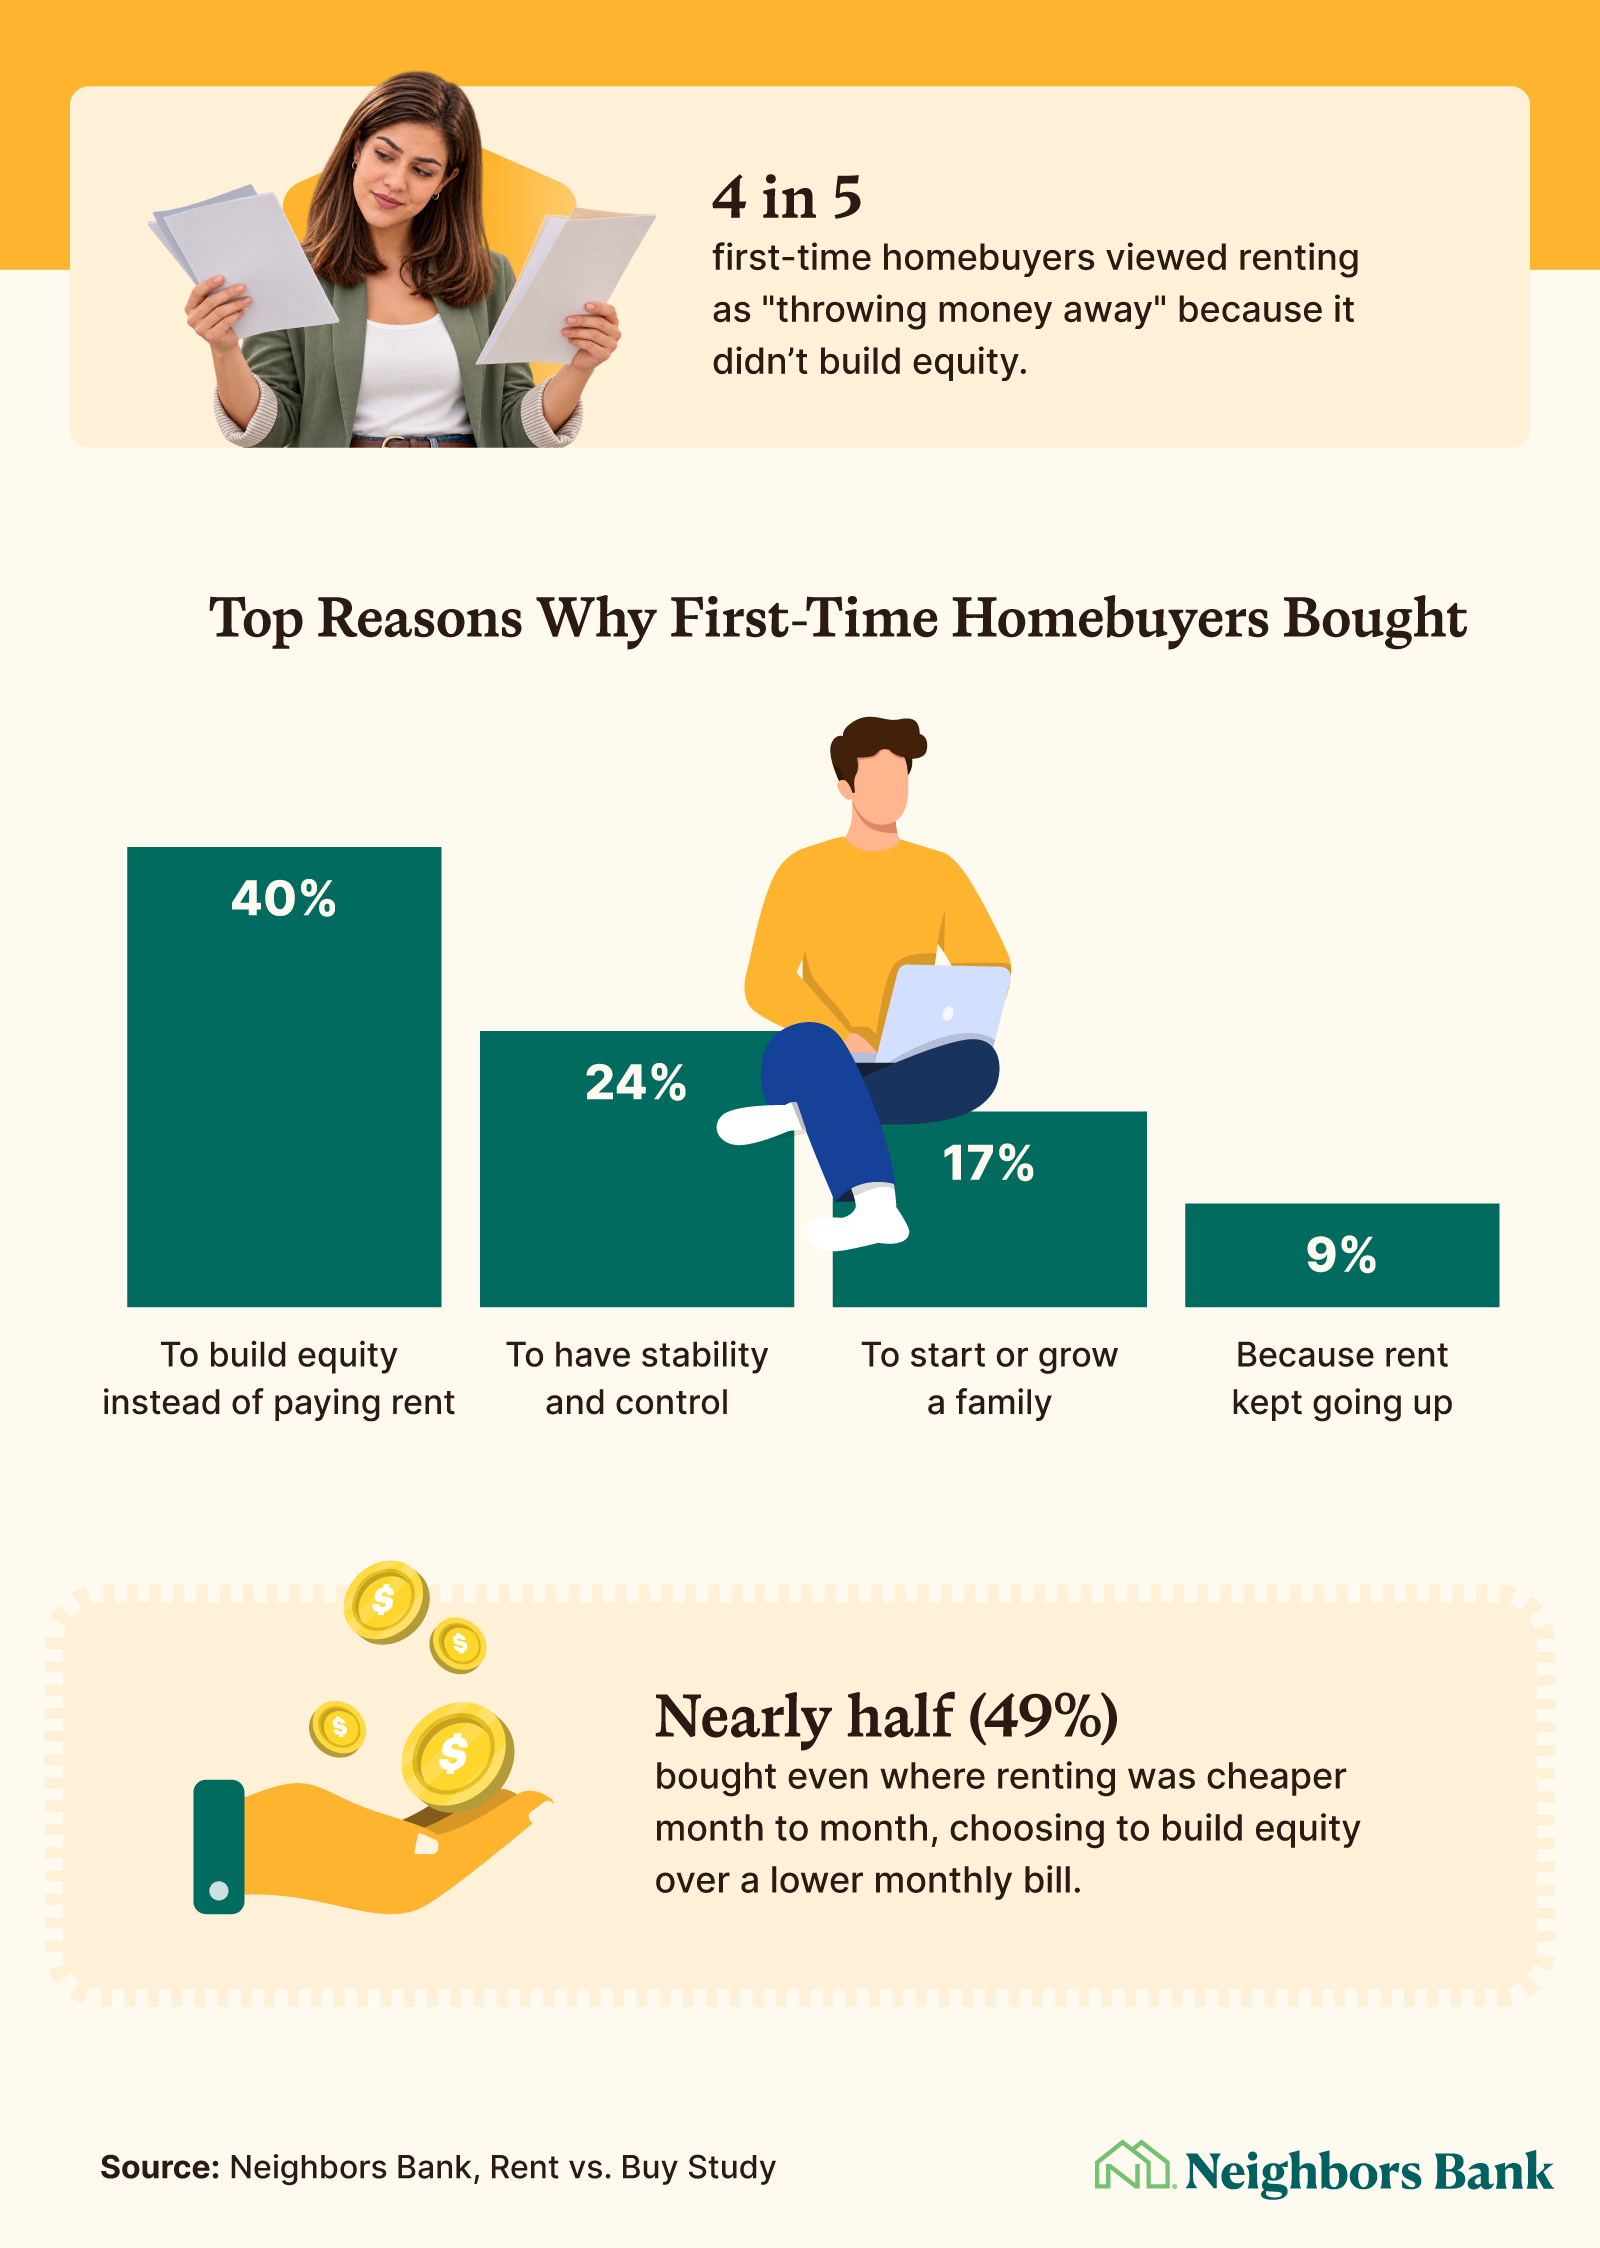
Building equity was the top reason first-time homebuyers purchased a home, selected by 2 in 5. Fewer than 1 in 10 (9%) named rising rent as their main reason. More than 2 in 5 first-time homebuyers (44%) bought expecting to refinance their loan at a later date.
Equity is simply the share of the home an owner actually holds, and it grows two ways: with every mortgage payment that chips away at the loan, and when the home itself gains value over time. It doesn’t happen overnight. Buying comes with upfront costs like closing and moving, so the early years are mostly about getting established. But as equity builds, it becomes money an owner can put to work, by borrowing against it through a home equity line of credit or a cash-out refinance, or by realizing the gains at sale. That long-run upside is what renting can’t offer, and it’s part of why many buyers chose to own even where renting cost less month to month.
Younger homebuyers were more likely to have delayed buying in hopes that mortgage rates would fall, but a recent study shows that rates are currently lower than what most prospective buyers think. About 2 in 5 Gen Z and millennial homebuyers (43%) waited for lower rates before purchasing, compared with nearly 3 in 10 Gen X homebuyers (30%).
Overall, 80% viewed renting as a waste of money, and that sentiment was shared across ages. About 4 in 5 in every generation said renting threw money away.
How First-Time Homebuyers Adjusted Their Budgets
For many first-time homebuyers, purchasing a home meant adjusting everyday spending and savings. Their experiences highlight the value of planning for both the upfront purchase and the expenses that come with owning a home.
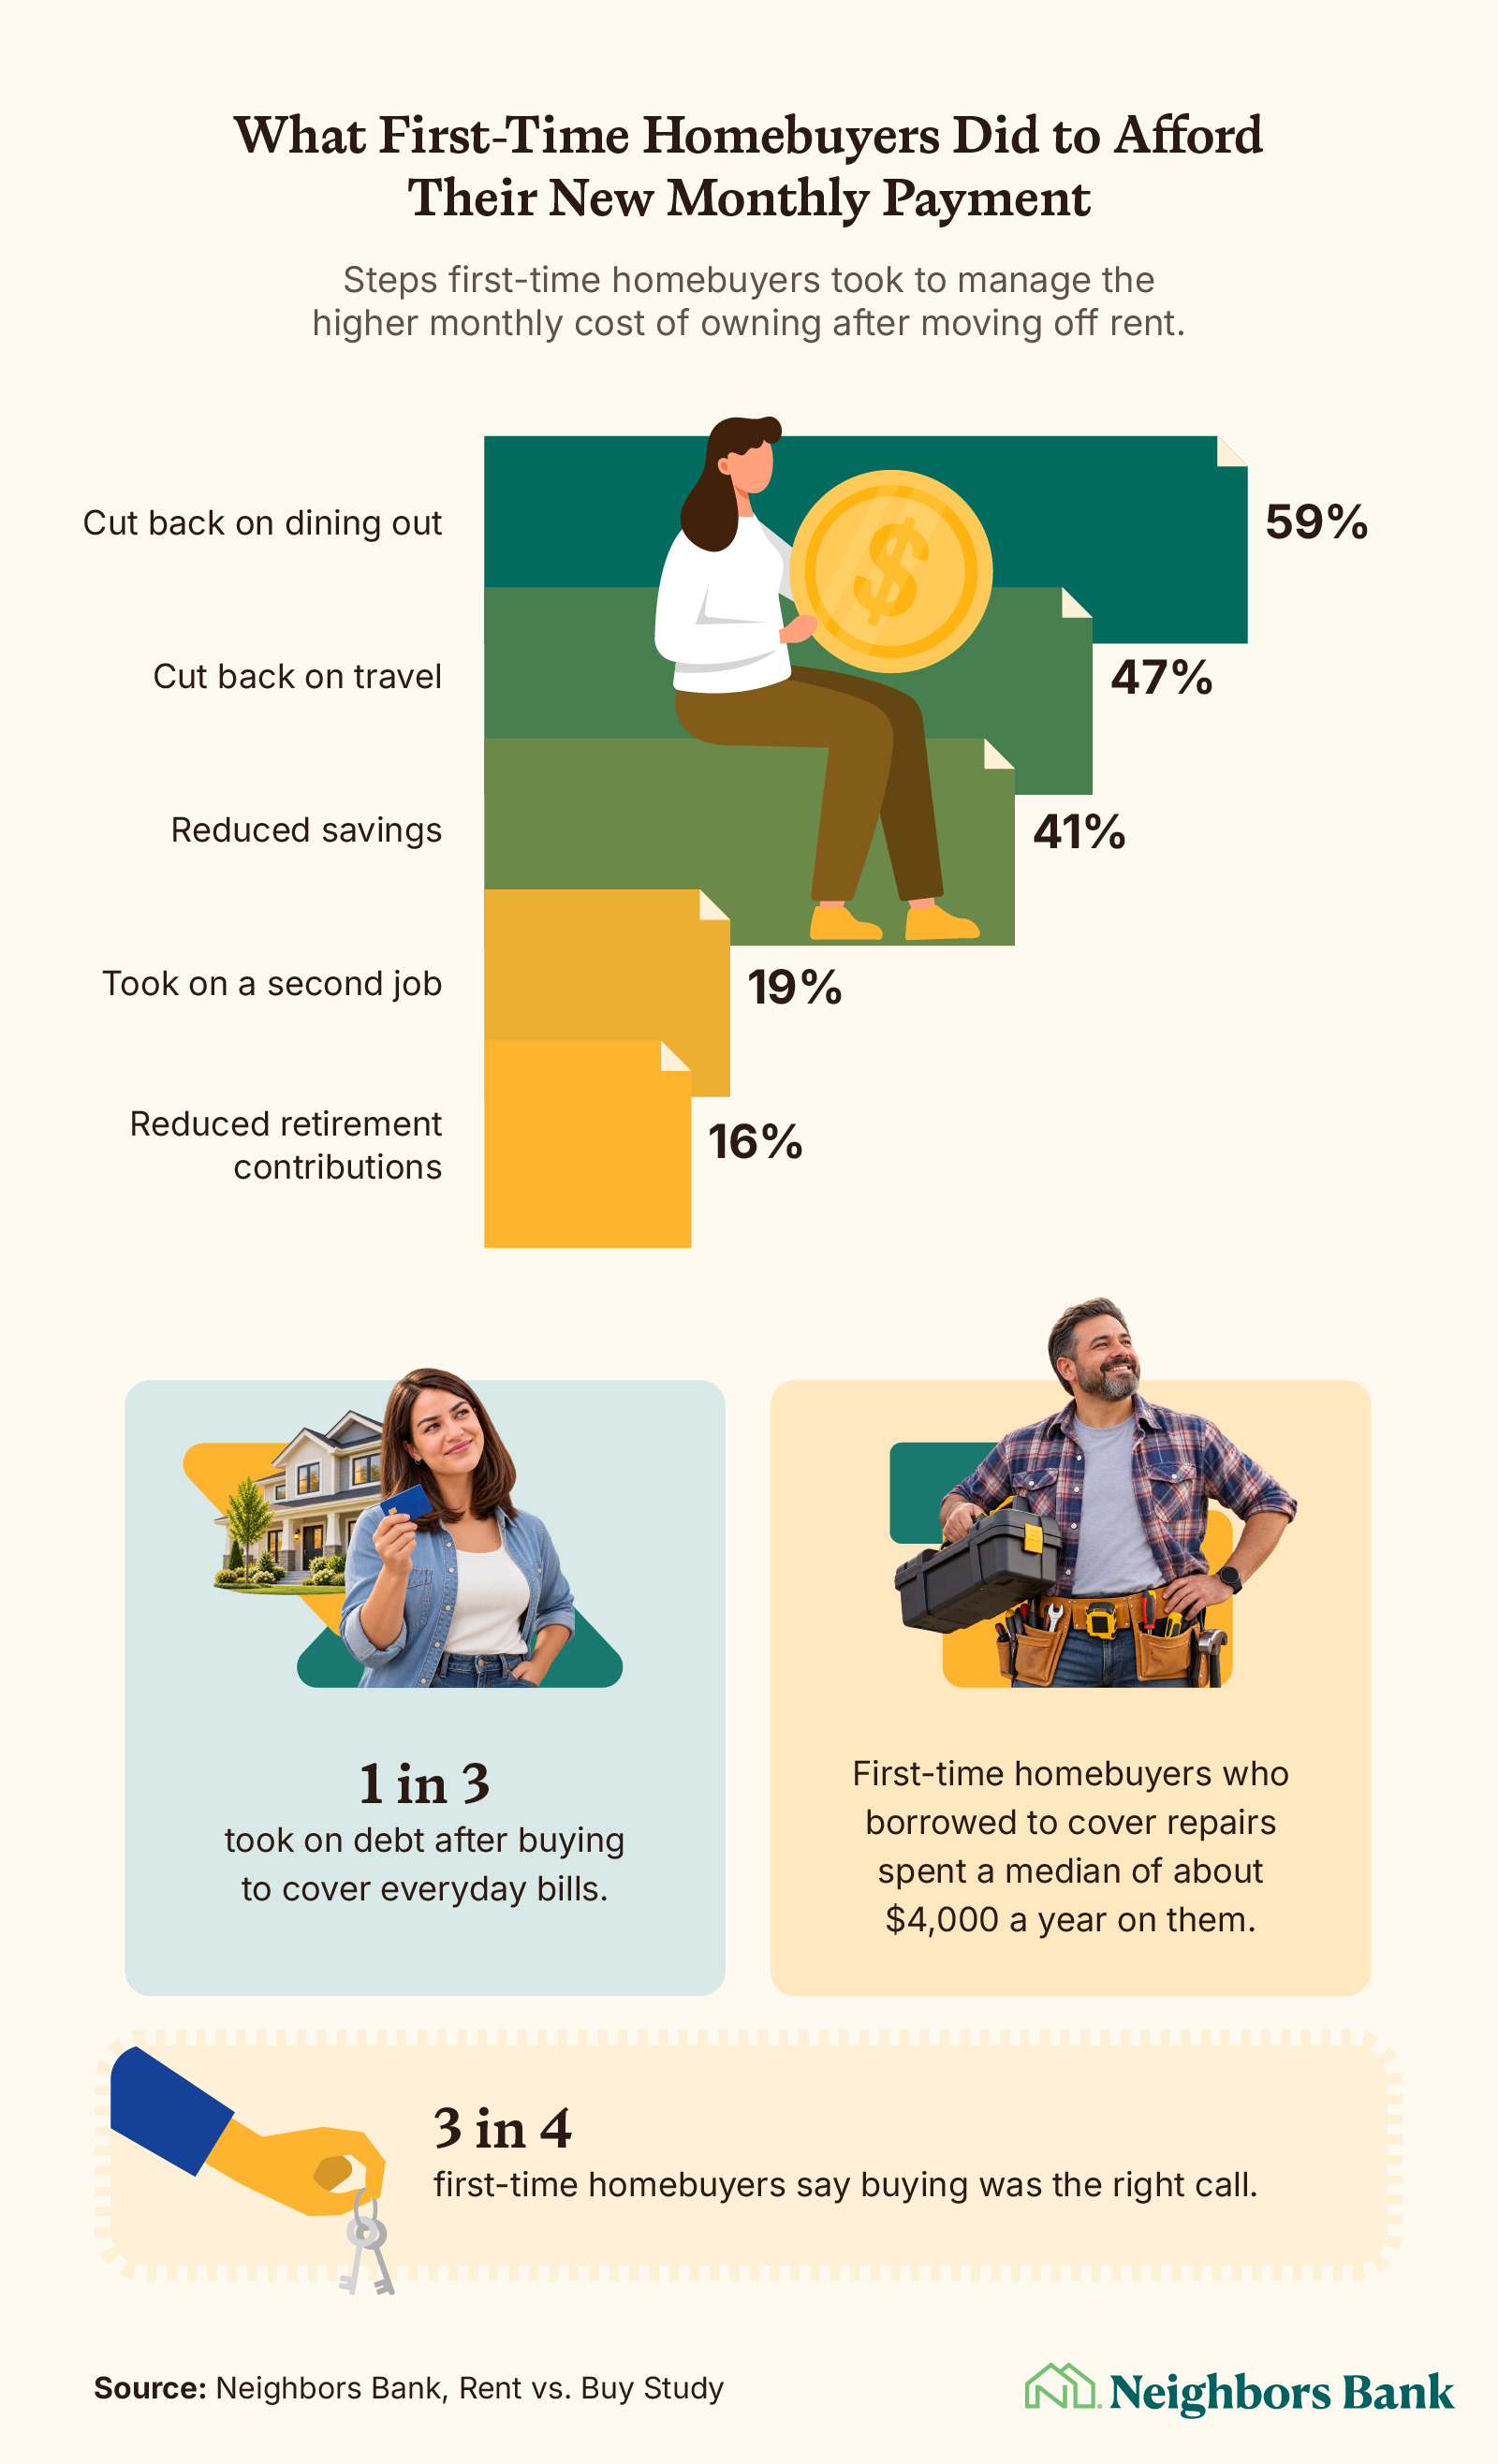
To afford a home purchase, first-time homebuyers were most likely to cut back on dining out (59%) and travel (47%). Nearly half reduced contributions to retirement or other savings (47%).
About 1 in 3 took on credit card or other debt after buying to cover costs they could handle as renters (33%). Among those who borrowed to pay for repairs, the typical bill ran about $4,000 a year.
How they funded the down payment varied:
About 4 in 5 used their own savings.
Roughly 1 in 3 got help from family.
About 1 in 9 used a down payment assistance program. Down payment assistance programs are offered by third parties and are subject to availability and eligibility.
Even with the trade-offs, most would buy their first home again, with 3 in 4 saying doing so was the right call.
What This Means for Those Weighing Buying vs. Renting
Buying a starter home had lower estimated monthly costs than renting in 46% of the metros studied, but local averages are only a starting point. A useful comparison includes the full cost of each option, room in the budget for unexpected expenses, and how long a household plans to stay.
Understanding loan eligibility can make that comparison more specific for homebuyers. FHA loans may offer an option for those with limited savings or less-than-perfect credit, while USDA loans require no down payment for eligible rural and suburban homebuyers. While conventional 97 loans allow eligible buyers to make a minimum 3% down payment. Exploring these options can help prospective homebuyers estimate their costs and decide whether buying or renting better fits their circumstances.
Methodology
Neighbors Bank compared the monthly cost of buying to renting across the 50 largest U.S. metro areas, as of July 2026. Buying is the monthly cost of a starter home, an entry-level single-family house, and includes mortgage principal and interest, private mortgage insurance, property taxes, and homeowners insurance, with 5% down on a 30-year fixed loan. FHA, VA, and USDA loans were not modeled, and private mortgage insurance is the only mortgage insurance included. It excludes utilities, maintenance, homeowners' association fees, closing costs, and the equity an owner builds. Renting is the current asking rent for a comparable single-family home. Throughout, a city means its metro area, the city plus its suburbs.
Home values and rents are from Zillow (bottom-tier single-family home value and single-family asking rent, July 2026). Mortgage rates are the monthly average of Freddie Mac's weekly 30-year fixed rate, about 6.5% in July 2026, with the latest weekly rate of about 7.3% tested as well. The median-priced home used for context comes from the Atlanta Fed's Home Ownership Affordability Monitor, and existing-renter rent from the Census Bureau's American Community Survey. Private mortgage insurance follows Freddie Mac guidance of about 0.36% to 0.84% of the loan a year, with a 0.60% midpoint. Homeowners insurance uses a current state-average premium scaled to each home's value, with a minimum floor, and a 2022 NAIC average is tested as a sensitivity analysis. Property taxes are scaled from Atlanta Fed figures.
The 50 metros are the most populous by 2024 Census population. We used asking rents, the prices currently listed, which tend to run a little higher than what renters actually end up paying. That’s a conservative choice: it makes renting look slightly cheaper than it is, so it works against buying rather than for it.
Neighbors Bank surveyed 1,166 U.S. adults who bought their first home in 2023 or later and who live in one of the 50 largest metro areas. Answers reflect what buyers said about themselves. Generationally, 18% were Gen Z, 67% were millennials, 14% were Gen X, and 1% were baby boomers. Percentages may not total 100% because of rounding.
About Neighbors Bank
Neighbors Bank is a home loan lender focused on making homeownership more affordable and accessible. The bank combines digital mortgage tools with personalized guidance to help homebuyers understand their financing options and the homebuying process.
Fair Use Statement
You are welcome to share these findings for noncommercial purposes. If you do, please link back to this page so readers can see the full study and methodology and the researchers receive proper credit.